Systems
Parts of a River System
- Drainage Basin: Area where rainwater collects before draining into a river or sea
- Consequent Stream: Stream that follows the slope of the land
- Subsequent Stream: Streams that join the consequent stream at nearly 90°
- Main River: Main channel carrying most of the water
- Tributaries: Smaller rivers flowing into the main river
- Source: Starting point of the river
- Mouth: Where the river ends (sea, ocean, or lake)
- Delta: Triangular or fan-shaped landform at the mouth formed by deposition
- Distributaries: Channels branching off from the main river, usually in deltas
Subsystems of a River
Collecting System (Branches)
Network of tributaries in the upper course that collect water and sediment and funnel them into the main river.
Transporting System (Trunk)
The main river channel that transports water and sediment towards the sea.
Dispersing System (Roots)
Network of distributaries at the river mouth where sediment and water spread into the ocean or lake.
Denudation
Erosion
Erosion is the wearing away and movement of rock, sediment, and soil by natural forces.
- Hydraulic Action: Force of water removes material
- Attrition: Load breaks down by colliding with itself and riverbed
- Abrasion: Sand and pebbles scrape the bed and banks
- Corrosion: Load dissolves and is carried in solution
Transportation
- Traction: Large material rolls along the riverbed
- Saltation: Small pebbles bounce along the bed
- Suspension: Fine material floats in water
- Solution: Dissolved material transported in water
Deposition
River Processes by Course
| River Course | Dominant Process |
|---|---|
| Upper Valley | Mainly erosion (vertical erosion, hydraulic action, abrasion) |
| Middle Reaches | Mainly transportation with some deposition |
| Lower Reaches | Mainly deposition |
Upstream vs Downstream
Upstream has less water and energy. As tributaries join, downstream has more water, higher energy, and increased erosional power.
River Landforms
Formed by Erosion
- Waterfalls: Form where hard rock meets soft rock
- Rapids: Turbulent flow over alternating hard and soft rock
- Potholes: Cylindrical holes formed by abrasion
Formed by Erosion & Deposition
- Meanders: Curves caused by erosion on outer bank and deposition on inner bank
- Oxbow Lakes: Formed when a meander is cut off
Formed by Deposition
- Braiding: River splits into multiple channels
- Floodplains: Flat land formed by repeated flooding
- Levees: Raised river banks from deposited sediment
- Deltas: Deposits at the river mouth
Drainage Patterns
- Dendritic: Tree-like branching
- Parallel: Streams run parallel
- Radial: Streams flow outward from a center
- Rectangular: Right-angle bends
- Trellised: Long parallel streams with short joining tributaries
- Annular: Circular or concentric patterns
Hydrographs
- Rising Limb: Upward slope showing increasing discharge after rainfall
- Lag Time: Time delay between peak rainfall and peak discharge
Short lag time: Steep rising limb → water reaches the river quickly → higher flood risk
Long lag time: Gentle rising limb → slower runoff → lower flood risk
Causes of Flooding
Natural Causes
- Prolonged or Heavy Rainfall: Increases river discharge
- Rock Type (Geology): Impermeable rock increases runoff
- Gradient / Relief: Steep slopes increase flood risk
- Vegetation: Less vegetation → less interception
- Weather: Dry soil after hot periods increases flash flooding
Human Causes
- Deforestation: Reduces interception
- Urbanisation: More impermeable surfaces
- River Channel Modification: Straightening reduces capacity
Waves
- Constructive Waves: Strong swash, weak backwash → deposition
- Destructive Waves: Strong backwash, weak swash → erosion
Swash: Wave movement up the beach
Backwash: Water flowing back to sea
Bays and Headlands
Bays and headlands form where softer rock erodes faster than harder rock, leaving hard rock jutting out as headlands.
Hard Engineering
Coastal
- Seawalls: Reflect waves but may increase erosion nearby
- Breakwaters: Reduce wave energy offshore
- Groynes: Trap sediment but reduce supply downstream
- Revetments: Sloped structures absorbing wave energy
Fluvial
- Dams: Control flow and generate electricity
- Levees: Prevent flooding along riverbanks
- Channelisation: Straightening rivers for flood control
Soft Engineering
Coastal
- Beach Nourishment: Adding sand to beaches
- Dune Restoration: Planting vegetation
- Managed Retreat: Allowing natural erosion
- Artificial Reefs: Dissipate wave energy
Fluvial
- Bioengineering: Plants and logs to stabilise banks
- Floodplain Management: Natural floodwater storage
- Habitat Restoration: Wetlands and native vegetation
- Community Engagement: Sustainable management
- Afforestation: Trees reduce runoff
- Floodplain Zoning: Restricting development
- River Restoration: Reintroducing meanders
Hard vs Soft Engineering
Hard engineering can disrupt ecosystems but provides immediate protection. Soft engineering is more sustainable but slower to show results.
Plastic Pollution
- Marine animals mistake plastic for food
- Microplastics bioaccumulate in food chains
- Health risks include endocrine disruption and cancer
- Creates jobs through recycling but is costly to clean
- Increased awareness promotes biodegradable alternatives
Mass Movement
Weathering
Importance of Rivers and Coasts
- Nursery grounds for marine life
- Coral reefs are biodiversity hotspots
- Rivers provide freshwater
- Coasts support tourism
Threats to Fluvial and Coastal Environments
- Pollution
- Climate change
- Habitat loss
- Overexploitation
Integrated River Basin Management (IRBM)
Coastal Zone Management (CZM)
An integrated approach to managing coastal resources sustainably, involving policy, infrastructure, and community engagement.
Conservation of Rivers and Coasts
- Habitat restoration
- Ecosystem rehabilitation
- Protecting endangered species
- Sustainable fishing, farming, and tourism
Climate Change Impacts
- Sea-level rise
- More floods and droughts
- Ocean acidification
- Declining water quality
Monitoring and Evaluation
- Data collection
- Performance indicators
- Regular assessment
- Reporting and feedback
Technology in Conservation
- Remote sensing and drones
- AI for predicting ecological risks
Case Studies
Holderness Bay (UK)
Causes of Erosion
- Strong winds and destructive waves
- Cliffs made of soft boulder clay
- Longshore drift removes sediment, exposing the coast
- Sea-level rise increases future erosion rates
Management Strategies
- Rock groynes: Trap sediment and build wider beaches
- Rock armour: Absorbs and deflects wave energy
- Sea walls: Protect land in high-value areas
- Beach nourishment: Buffers wave energy
- Managed realignment: Allows natural coastal retreat
Evaluation
- Erosion rates have reduced in protected areas
- Groynes at Mappleton protect the village but starve southern beaches
- Sea walls are expensive to build and maintain
- Beach nourishment is temporary and costly
- Protection focuses on economically valuable areas
- Over 30 villages have been lost to erosion
The Sundarbans (India & Bangladesh)
Causes of Erosion & Risk
- Strong currents and frequent cyclones
- Constant sediment movement
- Coastline retreat of up to 200 m per year
- Climate change increasing cyclone intensity
Management Strategies
- Embankments: Protect islands from tidal flooding
- Mangrove reforestation: Stabilises sediment
- Early warning systems: Improve disaster preparedness
- Cyclone shelters: Reduce loss of life
- Community involvement: Promotes conservation
Evaluation
- Embankments disrupt natural water flow
- Poor maintenance has led to embankment collapse
- High failure rate of replanted mangroves
- Illegal logging and settlement pressure persist
- Funding shortages delay infrastructure upgrades
- Conservation goals conflict with local livelihoods
Mississippi River (USA)
Flooding Causes
- Drainage basin spans 31 US states and 2 Canadian provinces
- Increased rainfall and extreme weather events
- Wetland loss of 40 km² per year
Management Strategies
- Levees: Over 10 m high in some areas
- Dams and reservoirs: Regulate flow and generate hydropower
- Spillways: Divert floodwaters during extreme events
Evaluation
- Levees protect some areas but worsen flooding elsewhere
- Confining the river increases water speed and height
- Reduced sediment weakens floodplains and levees
- Spillways sacrifice rural farmland
- Critics argue hard engineering has destroyed natural flood control
Geography Notes – Urban Systems and Settlements
What is an Urban System?
An urban system is an interconnected network of buildings, services, transportation, power, water supply, microclimate, and humans. Investigating urban systems helps us understand urban efficiency and sustainability.
Urban versus Rural Settlements
Urban Settlements
Urban settlements are areas characterized by:
- High levels of infrastructure
- High population density
- Diverse economic activity
- Specialized industries based on local resources, e.g., Mumbai’s film industry or Bengaluru’s IT sector
Land Use in Urban Areas
- Residential Areas: Apartment blocks, gated communities, individual houses; primarily housing.
- Commercial Areas: Shops, offices, marketplaces focused on business and commerce.
- Industrial Areas: Warehouses and factories producing goods for sale.
- Institutional Areas: Schools, hospitals, public libraries, and other public institutions.
- Recreational Areas: Parks, stadiums, malls, arcades, and other areas for relaxation and leisure.
Rural Settlements
Rural settlements are characterized by:
- Lower levels of infrastructure
- Lower population density
- Limited economic diversity, often reliant on primary activities such as agriculture, fishing, or mining
Differences Between Urban and Rural Settlements
- Urban settlements often have multi-storey buildings due to limited land and higher population density.
- Urban areas have a mix of residential, commercial, industrial, institutional, and recreational areas.
- Rural areas are dominated by primary employment sectors and usually feature single-storey buildings.
Rural Settlements
Rural settlements consist primarily of single-storey buildings due to more available land, lower land value, and smaller population. These areas mainly include residential areas and agricultural land.
Hierarchy of Urban Systems
Urban hierarchy is the organization of settlements in ranked order based on population, function, diversity, services provided, and influence.
Importance of Urban Hierarchy
- Allows for appropriate resource distribution and urban planning strategies.
- Shapes economic development by concentrating wealth, functions, and services in higher-tier settlements such as metropolises.
- Helps researchers predict patterns of urban growth.
- Guides businesses in deciding where to invest.
Levels of Urban Hierarchy
- Hamlets: Population < 100. Primary function: agriculture. Minimal or no specialized services.
- Villages: Population 100–1,000. Primary function: agriculture, but basic services such as schools, healthcare, and markets are present.
- Towns: Population 10,000–50,000. Offer diverse services and commercial areas; act as regional hubs for multiple villages. Jobs include manufacturing and other non-agricultural industries.
- Cities: Population 50,000–1 million. Multiple, high-quality facilities such as hospitals, schools, and transport hubs. Economy includes diverse industries; residential, commercial, and industrial areas present.
- Metropolises: Population > 1 million. Major cultural, financial, and commercial hubs. Advanced infrastructure including domestic/international airports and metro systems. Specialized industries and services attract domestic and foreign investment.
- Megalopolises: Agglomerations of multiple metropolises connected geographically, economically, and socially. Shared economy, resources, public transport, and ecology. Retain distinct identities but have global economic influence and very high population densities.
Urbanization and Its Impact
Urbanization is the increase in the proportion of people living in urban areas. It is often associated with a decrease in rural populations, rural-to-urban migration, and overall city growth.
Causes of Urbanization
- Natural Increase: Population growth within cities due to births exceeding deaths.
- Migration: Movement of people from rural-to-urban or urban-to-urban areas.
Push and Pull Factors
Push factors: Conditions that drive people away from their current location:
- Political: instability, war, violence
- Economic: lack of jobs, low pay, unfair working hours
- Social: poor facilities, limited education or healthcare
- Natural: disasters, harsh environmental conditions
Pull factors: Conditions that attract people to a new location:
- Political: stable government, safety, low crime
- Economic: job opportunities, decent pay, better working hours
- Social: access to better education, healthcare, and facilities
Urban Sprawl
Urban sprawl is the unrestricted expansion of urban areas into surrounding undeveloped land, often without proper planning.
- Natural Impact: Destruction of wildlife habitats and fragmentation of remaining natural areas.
Urban Decline
Urban decline refers to the deterioration of a city due to economic downturns, depopulation, low investment, or poor infrastructure. Signs include abandoned buildings, declining infrastructure, and reduced economic activity.
Urban Fringe
The urban fringe is the edge of a city where urban and rural characteristics coexist. This area often experiences rapid development as cities expand outward.
Example: Farmlands on the outskirts of Delhi converted into residential areas.
Ghost Towns
Ghost towns are abandoned settlements with remaining infrastructure such as roads and buildings. They are often abandoned due to natural disasters, economic collapse, or human-made disasters.
Example: Pripyat, Ukraine, abandoned after the Chernobyl nuclear disaster. 👻
Gentrification
Gentrification is the process where low-value neighborhoods are renovated, attracting high-value brands and residents. This increases property values and rent, displacing original low-income residents.
Slums and Shanty-Towns – The Urban Poor
The urban poor are people living in urban areas with inadequate access to basic needs such as:
- Education
- Healthcare
- Employment
- Proper housing
- Food and water
They often reside in slums, shantytowns, or low-income neighborhoods with poor infrastructure, or may even squat illegally. Example: Informal settlements housing daily wage workers in Nairobi, Kenya.
Shanty Towns and Squatter Settlements
Shanty towns are makeshift settlements built by those unable to afford proper housing. They are typically constructed from cheap, easily available materials such as corrugated metal sheets, wood, mud, or plastic, and lack proper infrastructure.
Example: Rocinha in Rio de Janeiro, Brazil.
Squatter settlements are unauthorized housing settlements built on land not legally owned by the residents. Like shanty towns, they lack proper infrastructure and basic services.
Urban Renewal
Urban renewal is a strategic process undertaken by governments to redevelop and revitalize underdeveloped or poorly developed urban areas that have experienced urban decline.
Urban Pollution
Urban pollution refers to the contamination of urban areas by introducing pollutants into the environment, including:
- Air pollution
- Water pollution
- Land pollution
- Light pollution
Uneven Development
Uneven development occurs when there are significant differences in development indicators such as Human Development Index (HDI), Gross Domestic Product (GDP), and Gross National Income (GNI) between nations.
Factors Causing Uneven Development
Historical and Political Factors
- Colonization: Many developing nations were colonized in the 18th and 19th centuries, with exploitation of resources and populations affecting present-day development.
- Conflict: Wars destroy infrastructure, reduce budgets for healthcare, education, and industry, and hinder overall development.
Example: Gaza Strip, Palestine – 84% of health facilities destroyed by bombings. - Political Instability: Countries lacking stable governments struggle to attract investment and may face internal conflict.
Example: Syria – HDI of 0.5 in 2022 due to instability and conflict.
Economic Factors
- Poor Trade Links: Developing nations often have limited trading partners, reducing income from trade.
- Heavy Debt: Borrowing from developed nations for development or post-disaster recovery diverts funds from national growth.
- Emphasis on Raw Materials: Low-income nations mainly export raw goods, earning less profit than countries producing secondary goods from the same materials.
Physical Factors
- Natural Disasters: Floods, earthquakes, and other disasters damage infrastructure and reduce workforce availability.
- Climate: Extreme droughts, floods, and poor agricultural conditions reduce food production and export potential.
- Poor Farming Land: Mountainous or infertile land limits agricultural productivity and self-sufficiency.
- Lack of Natural Resources: Countries without sufficient natural resources struggle to generate profits and boost development.
Impacts of Uneven Development
- Wealth Divide: Uneven development widens the gap between developed and developing countries, and between income classes within a country. The rich get richer, the poor get poorer.
- Inadequate Healthcare: Poor development reduces access to quality healthcare, sanitation, and living conditions. Life expectancy suffers.
Example: Chad – 44 years; Japan – 75 years. - International Migration: People migrate from developing to developed nations, reducing the workforce in developing countries.
Example: Sudan – 10.7 million people displaced due to civil war.
Urban Regions and Agglomeration
Conurbation: A region where multiple cities, metropolises, and urban centres merge into a single continuous urban area through population growth and physical expansion.
Example: Greater Tokyo Area (Tokyo, Yokohama, and surrounding cities).
Agglomeration: The concentration of economic activities, industries, and population in a specific area. Benefits include economic growth, efficiency, and collaboration, but it can cause congestion.
Example: Silicon Valley, California – close proximity of multiple tech companies.
Impact of Urbanization on LEDCs
In LEDCs (Less Economically Developed Countries), urbanization is often driven by rural-to-urban migration. Younger populations migrate to cities, increasing birth rates and population growth in urban areas. Poor infrastructure and rapid urbanization lead to multiple challenges:
Housing Shortages
Rapid population growth strains the housing market. Without rent controls, landlords may inflate rent, forcing low-income residents into slums and shanty towns with poor infrastructure.
Solution: Invest in affordable housing projects and enforce rent control laws. Community Land Trusts (nonprofit organizations purchasing land and leasing it long-term) ensure housing remains affordable. Resale values are restricted to maintain accessibility for low- and middle-income tenants.
Traffic Congestion
Urban transport networks fail to accommodate the growing population, causing traffic congestion and increased air pollution.
Solution: Develop efficient public transport systems using technologies such as IoT to monitor congestion. Plan mixed-use zones to reduce travel distance between residential and commercial areas.
Unemployment
The job market cannot match population growth, leaving people unemployed or in informal, unstable work (e.g., day labourers, street vendors).
Solution: Invest in infrastructure to attract businesses, creating new employment opportunities.
Pollution
Urbanization leads to increased pollution from carbon emissions, burning fossil fuels, and household waste. Outdated or insufficient policies exacerbate the problem.
Solution: Implement waste management policies, pollution regulation, and sustainable urban planning.
Impact of Urbanization on MEDCs (More Economically Developed Countries)
Compared to LEDCs, MEDCs have had a "head start" in urbanization. Urban growth in MEDCs is plateauing, and older inner-city infrastructure and industries often close down. This leads to urban decay and the outward movement of newer industries due to space constraints. Urban revitalization projects are undertaken, but gentrification often follows.
Urban Sprawl
As inner cities are overcrowded, MEDC urban areas expand outwards into suburbs and rural areas, often at the expense of greenery and farmland.
Solution: Sustainable urban planning can optimize inner-city space usage and reduce the need for outward expansion.
Aging Infrastructure
Overcrowding in inner cities forces higher-income residents to suburbs, leaving older inner-city infrastructure under-maintained and lower quality.
Solution: Urban renewal upgrades facilities and infrastructure, improving residents’ quality of life.
Gentrification as a Byproduct of Urban Renewal
Urban renewal attracts higher-income residents and luxury brands, increasing property values and displacing low-income residents. This can create social tensions between new and original residents.
Solution: Implement rent control and mandatory affordable housing. Engage communities in planning to ensure urban spaces meet local needs.
Cultural Tensions
Affordable inner-city housing attracts immigrants, creating cultural diversity but also potential discrimination. Language barriers may restrict job opportunities, worsened by gentrification.
Solution: Offer free local-language classes for immigrants and promote tolerance and inclusivity to reduce social tensions.
Pollution
Urbanization and industrialization in MEDCs degrade the environment. Carbon emissions from vehicles and factories reduce air quality, while improper disposal of industrial waste causes land and water pollution.
Solution: Enforce environmental regulations, promote green transport, and invest in sustainable industrial practices.
Sustainable Urban Management
Sustainable urban management involves policies, strategies, and methods for managing urban areas to meet the needs of current residents without compromising the quality of life for future generations. It focuses on achieving three key goals:
1. Environmental Sustainability
Measures are implemented to reduce or neutralize a city’s carbon footprint. Construction and development projects use natural resources responsibly, ensuring minimal impact on the environment.
2. Economic Sustainability
Economic sustainability focuses on creating jobs, widening the job market, and providing diverse economic opportunities. A self-sustaining urban economy emerges, benefiting residents and local businesses.
3. Social Sustainability
Social sustainability promotes environmental justice and social equity. All stakeholders are involved in planning, ensuring fair access to infrastructure, services, and opportunities for every resident.
Methods to Achieve Social Sustainability
Social sustainability is supported by collective management, involving governments, private institutions, and citizens working together to manage and develop urban areas.
- Inclusive Decision-Making: Decisions consider the needs and impact on all stakeholders.
- Community Participation: Encourage and support local small businesses and initiatives, such as community gardens, that foster participation and engagement.
- Public-Private Partnerships (PPP): Long-term collaborations between governments and private institutions to finance, build, and operate projects.
- PPPs allow large-scale projects like roads, hospitals, or bridges to be completed faster or at all, particularly when governments are unable to finance them.
- Private companies may fund construction in exchange for profits from public usage, e.g., toll fees.
- Risks of PPPs: Quality of service may be compromised, or profits may fall short if public usage is lower than expected.
Sustainable Solutions in Indian Cities
1. Promoting Metro Systems
Traffic congestion is a major issue in Indian cities, leading to wasted time, fuel, and increased carbon emissions. Widespread construction and promotion of metro systems can:
- Reduce traffic on streets.
- Lower carbon emissions from private vehicles.
- Improve overall efficiency of urban transport networks.
Example: As of 2024, Kolkata, Bengaluru, and Pune rank among the world’s five slowest cities for traffic, highlighting the urgent need for improved public transport systems.
2. Rainwater Harvesting
Rapid urbanization reduces permeable surfaces, preventing rainwater from entering the soil. This leads to:
- Overflowing open drains.
- Flooding of water bodies.
- Depletion of underground water supplies.
Rainwater harvesting mitigates these issues by collecting and storing rainwater for future use.
Example: The Rainwater Harvesting and Storage Bill (2016) mandates:
- Government education programs to raise awareness.
- Support for NGOs promoting rainwater harvesting.
- Construction of harvesting systems on properties ≥ 1100 sq. meters.
- Legal penalties for non-compliance, including fines and imprisonment.
3. Urban Farming
With India’s growing population, demand for food is high, while urban sprawl reduces available agricultural land. Urban farming integrates agriculture into city spaces through:
- Rooftop farming.
- Vertical gardens.
- Community gardens.
These practices increase local food production, promote sustainability, and reduce the need for transporting food over long distances.
Challenges in Sustainable Urban Management
Implementing sustainable urban management is a complex process, and several challenges can hinder its effectiveness:
-
Lack of Funding: Cities often face limited financial resources, which restricts sustainable development projects.
- Solution: Use Public-Private Partnerships (PPPs) to fund projects.
- Solution: Encourage businesses and startups to adopt sustainable practices and invest in urban management initiatives.
-
Red Tape: Bureaucratic procedures and administrative hurdles can delay or obstruct policy implementation.
- Solution: Streamline procedures and promote better coordination between governmental departments.
-
Public Resistance: Citizens may be unwilling to follow new policies, especially those that require lifestyle or behavioral changes.
- Solution: Conduct public awareness campaigns to educate residents on the importance of sustainable practices.
-
Policy-Level Issues: Policies may fail if they are not inclusive or fail to account for all stakeholders.
- Solution: Strengthen policy frameworks to include diverse community perspectives.
- Solution: Incorporate regular monitoring and evaluation to measure policy effectiveness and make adjustments as needed.
S.U.M.P. (Sustainable Urban Mobility Planning)
The acronym S.U.M.P. stands for Sustainable Urban Mobility Planning, which focuses on improving public transport networks in urban areas to make them more accessible, efficient, and environmentally friendly.
A sustainable urban mobility plan should cover the entire urban area it addresses and be designed in partnership with local residents and stakeholders such as privately-owned corporations, government bodies, and NGOs.
Example: The Trans-European Transport Network (TEN-T) is a planned series of transport networks across the European Union. Its regulations define a series of indicators across sustainability, safety, and accessibility, which are used to monitor progress and guide the implementation of mobility priorities.
Planning Approaches within S.U.M.P.
1. Neotraditional Development
This approach focuses on creating walkable urban areas with mixed-use zoning while preserving traditional architectural styles. Public spaces and multiple modes of transport (not just cars) are incorporated.
Example: Vauban, Germany
Benefits:
- Reduces dependency on cars.
- Promotes healthy social interactions among residents.
- Efficient use of land.
Criticisms:
- Property values can increase due to proximity to workplaces and commercial areas.
- Architectural creativity may be limited due to mixed-use zoning constraints.
- Implementing these measures can be challenging in already-developed urban areas.
Urban containment
Urban containment: Used to limit unnecessary urban sprawl by limiting development to within city limits and preserving open areas for agricultural use, aesthetic value, and environmental reasons. Ex: Vancouver, Canada. Urban containment can best be represented through the urban containment model, which consists of four main components:
- Urban growth boundaries define city limits.
- High-density development occurs within the city to ensure all space is efficiently used.
- Land-use zoning is typically mixed.
- Public transit is integrated.
- Greenbelts are natural buffers around city limits and provide recreational green spaces.
- Infill development is promoted, to reduce urban decay and ensure that underused spaces are used to their full capacity and potential.
Challenges to urban containment include political resistance a la red tape, housing affordability and difficulty in implementation.
A good example is the city of Vancouver in Canada. The city has an Urban Containment Boundary which is a stable, well-defined area beyond which urban development does not occur.
Compact cities
Compact cities: These cities ideally have a high population density and mixed-use developments to reduce excess energy consumption and traffic congestion and be a better use of resources. However, despite all the benefits of compact cities, they can still fall prey to issues such as overcrowding due to being reluctant to expand outwards. Ex: Hong Kong, China.
A good example of this is the city of Hong Kong, China:
With regards to its high population density, Hong Kong has greatly developed its public transport systems and incorporated walkability into its urban planning:
- The metro system carries more than 4 million passengers per day.
- The three major bus networks carry more than 3.5 million people per day.
- Walk Scores rated Hong Kong as a “walker’s paradise”, with a score of 98/100.
- Car ownership rates are just 59 per 100 people, lower than the world average of 124 per 100 people.
Despite being dense, the city prioritizes natural spaces:
- 40% of the inner city landmass is used as parks, with there being 24 country parks in total.
- In Kowloon, open spaces are just 500 meters away from bus stops.
Eco-cities
Eco-cities: These cities, centred around utilizing advanced technology to avoid disrupting natural processes and ecosystems while still promoting urban development. Furthermore, eco-cities also possess a circular economy, where resources and materials are sourced through and participate in a closed-loop system where they are perpetually recycled into the economy, making it less vulnerable and more secure and resilient. However, as a result, the initial costs of designing and implementing the various features of an eco-city are expensive, combined with the fact that these cities are in the end still highly technology-dependent.
They accomplish this by implementing features such as sustainable or renewable energy sources (wind energy, hydroelectricity), utilizing resources efficiently, compact and mixed-use zoning (as opposed to widespread, single-use zoning), sustainable transport (biking, walking, public transport over private), integration of technology, and a closed-loop economy (no waste is generated, and all resources are always utilized, recycled, and repaired).
However, constructing and implementing these features has a high initial cost, and the monitoring required to maintain the level of sustainability leaves the city dependent on technology which is vulnerable to data breaches.
Examples include:
- Sino-Singapore Tianjin Eco-city, Binhai, China.
A notable example is Tianjin City, China. Much of the city is powered by renewable energy sources such as geothermal, wind, and solar. Buildings are designed to be eco-friendly and must fit said specifications. Furthermore, desalination plants and wastewater treatment facilities ensure a constant, renewable supply of potable water. Public transport is promoted, and the overall sustainability of the city is evaluated on three parameters which are based on a “Three Harmonies” framework: environmental, social, and economic, which match up with the three goals of sustainable urban management. The Eco-City has a walking and cycling pathway called the Eco Valley. The use of electric vehicles is promoted by installing charging stations across the city. The city serves a political purpose as well, as it proves that any piece of land can be made into an arable, sustainable area. Prior to development, the area was all polluted water, salt pans, and non-arable land which could not support agriculture. The city was deliberately built here to prove the above point.
2008 saw the Chinese and Singaporean governments define 26 KPIs (Key Performance Indicators) to measure the scope and success of the city’s economic, environmental, and social development. These included guidelines for levels of pollution, quality of life, sustainability of transport systems, waste generation, and generation of employment opportunities.
The KPIs set to be achieved by 2030 include:
- All Eco-City residents to be covered by the social security package provided by the Chinese government.
- Develop a Research and Development (R&D) system with a minimum of 150 scientists and engineers for every 10,000 employed people overall.
Goals set to be achieved by 2035 include:
- Increasing the percentage of overall housing that affordable housing makes up by 20%.
- Achieve a recycling rate of 70%.
- Achieve 100% city-management digitization.
- Limit carbon emissions to under 100 tons per 1 million USD of their GDP.
- Having at least 75% of companies participate in innovation activities.
- Employing at least 50% of the local employable citizens of the city.
Freiburg, Baden-Württemberg, Germany
Located in the south of Germany, Freiburg is situated within Germany’s famous Black Forest. The city aims to be 100% powered by renewable energy by 2025 by increasing energy efficiency and reducing energy consumption by 50% in both factory and domestic settings.
In terms of the natural environment, Freiburg uses two-thirds of its land area for green uses:
- 40% of the city is covered by forest.
- 44% of wood from local forests is used for timber, of which 75% is grown back within a year.
- 56% of forests are nature conservation areas.
- 600 hectares of parks contain only native vegetation.
- 44,000 trees have been planted in parks and streets.
- The River Dreisam is not managed and no dams have been built upon it, thereby not endangering the natural habitats of local flora and fauna.
- 32% of land area is used for urban purposes.
Being one of the few cities in Germany that receives ample sunlight, several districts in Freiburg are largely solar-powered. A good example is Vauban, where the majority of electricity is generated through rooftop solar panels or photovoltaic panels (PV).
Buildings in Vauban are either passive solar energy buildings, meaning they consume as much energy as they produce, or plus-energy buildings, meaning they produce more energy than they consume. Furthermore:
- Freiburg uses rainwater harvesting channels built into its streets called bӓchle.
- It also has permeable pavement for rainwater to seep through and replenish underwater reservoirs, as well as unpaved tramways.
- Baden-Wurttemberg declared a wetland near Freiburg to be a protected nature reserve.
Freiburg also aims to cut down on urban sprawl by centering its development around transit:
- 1990s: The speed limit was reduced to just 30 km/h in side streets. This improved safety as well.
- ⅓ of residents in Freiburg don’t own a car, and prefer to use the tram system instead.
Freiburg also pays close attention to waste generation and management:
- Enough energy to power 28,000 homes has been generated from burning waste.
- Annual tonnes of waste disposed has decreased from 140,000 tons to just 50,000 tons in only 12 years.
- 88% of packing waste is recycled, largely due to the fact that 350 community waste collection points have been established, from where trash is taken to be recycled.
- Biogas, generated from food and organic waste, makes up a large percentage of the renewable energy Freiburg generates.
All this was made possible through Freiburg’s huge emphasis on community engagement:
- Urban planners account for community needs and feedback to any developments to ensure their solutions are tailored to best meet the needs of the public.
- The renewable energy industry provides employment for a large fraction of the public. Solar panel manufacturing companies situated in Freiburg employ around 1,000 locals.
- Citizen participation in sustainable activities is rewarded through financial rewards for composting waste and cutting down on medical waste.
Urban Planning Strategies
Developing multipolarity: Rather than have a single hub of commerce and development within a city, multipolarity focuses on dispersing urban functions and creating multiple centres of activity throughout the city, reducing the need for long commutes and by extent, traffic congestion.
Benefits:
- Reduced commute distance.
- Less traffic congestion.
- Urban redevelopment: Creating new city hubs requires the development of the surrounding area, promoting urban redevelopment.
Consequences:
- Gentrification: Housing prices in low-income neighbourhoods may rise due to being in proximity with city centres, displacing low-income, usually minority clients.
Targeted Densification
By intentionally promoting densification in specific areas, land can be used efficiently and the need for private car ownership is reduced.
An example is Oesterbro, a district in Copenhagen, Denmark. Targeted densification in Oesterbro led to population density increasing by 5.9%, higher than the average increase for all of Copenhagen. However, gentrification in the city has led to social exclusion as low-income tenants have been forced to leave their homes. Regional interests and local interests also fought for the redevelopment of a deserted factory zone into a park. Furthermore, certain housing regions inhabited by higher-income tenants do not make use of local facilities and instead commute by car to farther distances and use other facilities.
Benefits:
- Combats urban sprawl.
- Promotes efficient use of land.
Consequences:
- Reduced living space.
- Aggravated air and noise pollution.
- Increase in housing costs from proximity to various industries.
Higher Capacity Public Transport
Increasing the number of people public transport vehicles like metro systems and buses can hold reduces the number of people purchasing private cars.
Benefits:
- Reduced commute.
- Reduced air pollution.
- Reduced traffic congestion.
An example is the city of Bogota in Spain where 85% of residents live a walkable distance away from a public transport station that is frequently used. Furthermore, thanks to the development of the Bilbao Metro, the city of Bilbao in Spain has the lowest rate of private vehicle use of any city in Spain.
Improving Active Mobility
By making cities and roads more walkable and cyclist-friendly, cities promote active transport such as walking or biking in favour of driving, which also benefits a person’s health.
Consequences:
- Challenges made for people with mobility issues unless accommodations are incorporated.
- Noise pollution from people’s activity.
The city of Chandigarh, India aims to redevelop Sector 17 to be more walkable by prohibiting cars from entering the sector, as well as creating pedestrian paths and having rental cycle stands.
Transit-Oriented Development (TOD)
By focusing development around shortening commute and transit, mixed-use communities are fostered and traffic congestion is reduced.
Transit-Oriented Development (TOD) - Consequences
- Lack of multiple perspectives and focusing solely from a transit angle.
- Gentrification: Close proximity and quick commute to luxury facilities can raise housing prices in nearby areas and lead to gentrification.
15-Minute Cities
The idea that individuals living in an urban area should only be a 15 minute walk away from any facilities they require, similar to a 20 minute neighborhood.
Land Use Models
Burgess’s Concentric Zone Model
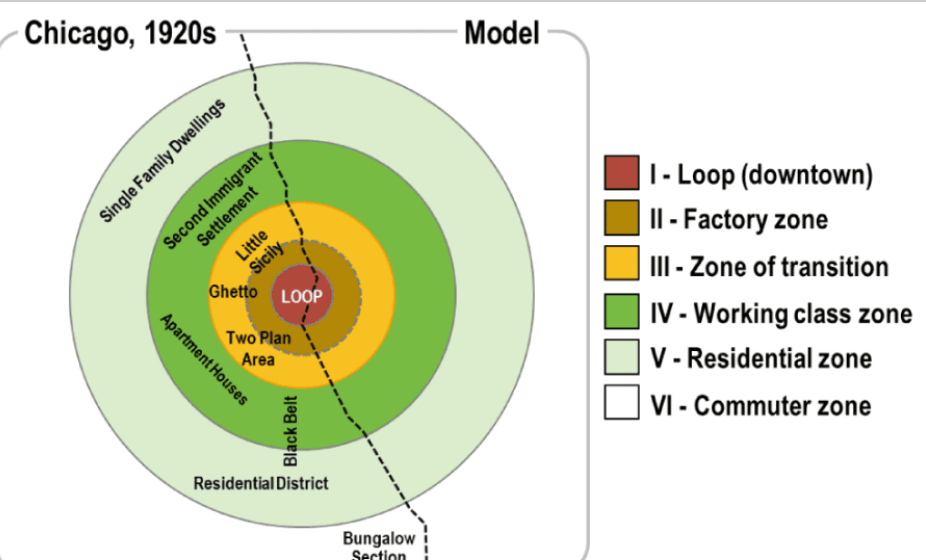 Developed in 1925 by Ernest Burgess, this model was based off of Chicago.
Burgess’s model represents the patterns of land use observed in Chicago as concentric rings surrounding the Central Business District (CBD), with each ring corresponding to a certain zone or type of land use.
Burgess Concentric Zone Model – Zones Explained
Central Business District (CBD): The innermost zone, and the main commercial and business part of a city, which, in Burgess’s model, is located in the center of the city.
Zone of Transition: The next zone, a mixed-use area. It houses a mix of commercial and residential properties, with the latter typically being of lower quality and cost compared to their counterparts in the working class, residential, and commuter zones. Mostly inhabited by the poorest segment of the population, namely workers who cannot afford to commute to the CBD, as well as first-generation immigrants and low-income families.
Working Class Residential Zone: The third zone, consisting of single-family homes of a higher quality and cost compared to the properties in the transition zone. Residents can afford to commute a short distance to the CBD.
Middle Class Residential Zone: The fourth zone, consisting almost entirely of higher-quality residential properties as compared to the inner zones. Occupied by inhabitants who can afford to commute slightly longer distances to the CBD.
Commuter Zone: The outermost zone, consisting of extremely high-value residential properties due to their distance from the overcrowded, polluted, and undesirable CBD. Essentially the suburbs, with spacious detached houses, front lawns, and backyards. Residents could afford to commute long distances daily to the CBD. This zone establishes a positive relationship between household income and current residence, as wealthier inhabitants move outwards to reside away from the CBD.
Limitations of the Burgess Concentric Zone Model
- American-centric: Burgess’s model was based on the American city of Chicago, particularly the patterns of urban land use observed in the area. Whereas in American cities, land away from the CBD is considered to be high value, other cities across the globe, such as Latin American, Middle Eastern, or Indian cities, often find that the inverse is true: land closer to the CBD is more valuable. Hence, Burgess’s model fails to account for the varying patterns of urban land use in other parts of the globe.
- A product of its time: Burgess’s model was based off of Chicago in the 1930’s, prior to the widespread use of personal cars, during a time when commuters relied heavily on public transport. As a result, Burgess’s model is very much a product of its time, and cannot be applied to cities where cars are almost exclusively the main mode of transportation.
- Fails to account for gentrification: Gentrification is the purposeful reconversion of low-value areas into high-value areas, attracting wealthier residents and leading to an increase in the rent and property values of surrounding properties, forcing out the previous, low-income residents of the area. Burgess’s model failed to account for gentrification occurring in the transition and middle-class residential areas, assuming that the commuter zone or suburban areas would remain high-value as the city continued to expand.
- Fails to account for geographic limits to expansion: Burgess’s model assumes that the space required for cities to constantly expand outwards would always be available. However, certain cities may be spatially limited in the extent to which they can expand outwards, such as being located near large bodies of water or near uninhabitable land, forcing economic development to occur inwards in limited areas.
- Over-emphasis on economic factors: Burgess’s model over-emphasizes the role of economic factors in determining the urban land use patterns of a city, with a person’s income determining their location of residence, and by extent, the land use patterns, and fails to account for various social and cultural factors that affect the spatial development of a city.
Hoyt’s Sector Model
Developed in 1939 by Homer Hoyt, modifying some key aspects of Burgess’s model.
Hoyt’s model proposes that, rather than expand outwards in concentric rings as with Burgess’s model, cities develop along major transportation networks which radiate from and coincide in the CBD, forming “wedges” or “sectors”. His model highlights the importance of transport routes in determining land value, and as a result, the socio-economic groups that would cluster around said sector, influencing the spatial and urban development of the city.
Hoyt’s theory arose after he conducted a study of rent across 34 American cities, through which he observed that areas in the same “circle” often had varying rent costs, whereas rent remained constant in “wedges” that radiated from the CBD. Combining his findings with maps of various physical features of the city, he observed the relationship between the rent in an area and its relative distance from a transport line, giving rise to his theory.

The working-class housing, similar to the Burgess model, is located alongside the major transport routes and adjacent to the factories and industrial areas, owing to the fact that the residents lack sufficient income to be able to commute long distances daily.
The middle- and upper-class housing developed furthest away from transport lines, with residents who can afford to commute long distances daily, once again similar to the Burgess model.
Limitations of Hoyt’s Sector Model
- A product of its time: Hoyt’s model was developed in 1939, prior to World War II, and can’t be applied to modern cities, rendering it a product of its time.
- Fails to account for cars and over-emphasizes railcars: Hoyt’s model, when considering modes of transportation, only takes into account railroads, and doesn’t consider personal cars, which weren’t widely used at the time.
- Doesn’t factor in topography: Certain natural geographic features, such as bodies of water, deserts, or mountain ranges, can obstruct a city’s development along a major transport line, contradicting Hoyt’s model.
- Over-emphasizes economic factors: Similar to Burgess’s model, Hoyt’s model assumes that the various socioeconomic groups inhabiting each sector reside there for solely economic reasons, failing to account for any cultural or social factors.
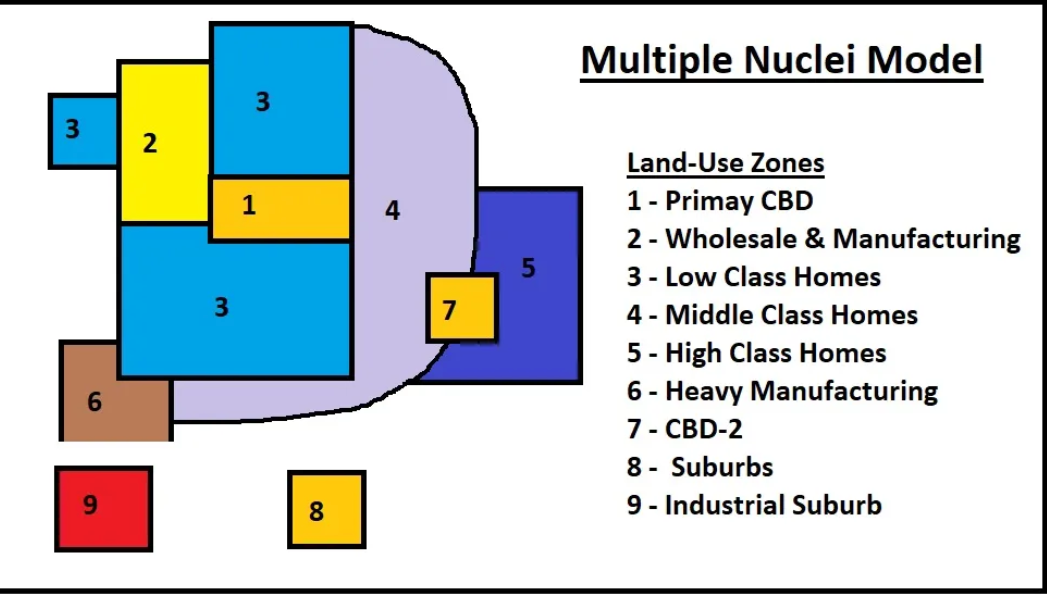
Multiple Nuclei Model
Developed by Chauncy Harris and Edward Ullman in 1945.
Differs drastically from Burgess and Hoyt models due to the notion it proposes of cities developing around multiple CBDs, compared to the latter’s idea that they develop around a singular CBD.
Harris and Ullman argued that though cities initially may possess only a single CBD, multiple smaller CBDs may develop near the suburbs to allow for shorter commute times. Furthermore, the widespread availability of cars allowed for greater movement, leading to the development of additional CBDs away from the initial nucleus.
The development of multiple CBDs can further be influenced by additional factors. Certain industries are typically separated in a city, such as recreational areas like parks and factories. On the other hand, other industries often flourish side-by-side, attracting more businesses and leading to the development of another CBD.
Furthermore, spatial limitations or requirements can influence the development of multiple nuclei– ports and the shipping industry develop away from the city centre, towards the outskirts near the coast, whereas other commercial activities may take place in the city itself.
A key assumption of the Multiple Nuclei model is that land is not flat. Unlike the concentric zone and sector models, it acknowledges the presence of certain physical features, such as landforms or bodies of water, which can limit or influence urban development in certain areas of the city, making it the most applicable for modern-day cities.
Limitations of the Multiple Nuclei Model
- Overlapping zones present urban planning challenges: The model fails to properly define where one zone ends and another begins, often resulting in overlap. This can present a challenge in urban planning, as the requirements of overlapping zones may contradict each other.
Islamic City Model
Shaped mostly by religious practices.
Differs from Western-centric models such as Burgess, Hoyt, and Multiple Nuclei Model due to the notion it proposes that Islamic cities develop outwards around a central mosque.
Islamic cities typically possess the following features:

- Mosque: Located in the heart of the city. Often attached to a Madrassa or educational institution.
- Suqs (markets): Markets or bazaars surrounding the mosque. The area also contained other public services such as baths (hammams) and hotels. Where items were sold depended on their nature– sacred goods such as incense sticks, candles, perfumes, and books were sold closer to the mosque.
Additional Features of Islamic Cities
- Casbah (citadel): The residence of the governor of the city, typically located in an elevated part of the area next to or as a part of the wall surrounding the city. Typically constituted its own district with a private mosque.
- Residential Quarters: Clusters of households based on personal ties between the residents. Each large cluster contained its own mosque, madrassa, and shops for daily necessities. Residential quarters in the cities of Algiers and Tunis possessed their own gates which opened and closed at prayer times. Often, separate religious groups would live in separate residential quarters, such as Muslims, Jews, and Christians living in separate areas in the residential quarter.
- Wall: A fortified wall with multiple gates surrounded the city.
- Exterior: Outside the city walls, Muslim, Jewish, and Christian cemeteries were present, as well as weekly animal markets along with private gardens and fields.
Factors Influencing the Urban Design of Islamic Cities
- Natural topography: City planning was adapted to natural circumstances such as the weather, temperature, and topography of the area.
- Religious and cultural beliefs: Religious beliefs contributed greatly to city planning, hence the construction of the mosque in the central position. Furthermore, cultural norms regarding the separation of public and private lives resulted in the construction of roads and streets that separated public areas like marketplaces from residential areas.
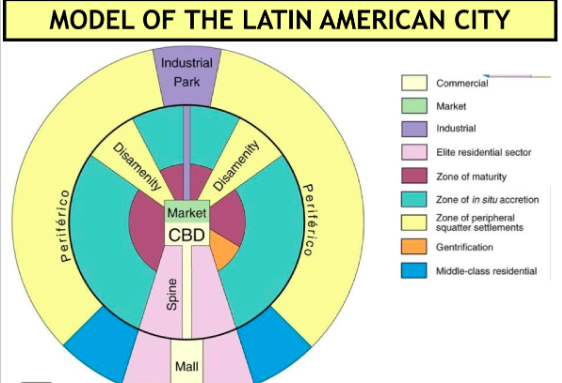
Latin American City Model
Developed by Ernest Griffin and Larry Ford in 1980.
Differs from Western-centric models such as the Burgess, Hoyt, and Multiple Nuclei models due to the notion it proposes that upper-class individuals choose to live closer to the CBD rather than further away.
Organization of a Latin American City
- The Market: The traditional, older CBD which adjoins the modern, newer CBD in the centre of the city.
- The Spine: A continuation of the features of the CBD, bordered by upper-class housing. Excellent infrastructure, with both commercial and residential properties.
- Zone of Maturity: Consists of infrastructure previously inhabited by upper-class residents before they moved out and resettled around the Spine, now occupied by middle-class tenants. Excellent infrastructure with fairly close proximity to the CBD. Gentrification may occur here.
- Zone of In-situ Accretion: A transitional zone between middle-class residential areas and peripheral squatter settlements. Typically occupied by lower-class residents with poor infrastructure.
- Zone of Peripheral Squatter Settlements: Inhabited by poor or homeless populations, with little to no infrastructure. Older squatter settlements are typically in better condition than newer ones, as living conditions may have improved over time due to gentrification or government action.
The design of Latin American cities was influenced by Spanish colonization. The Laws of the Indies, a series of laws enforced by Spain governing the political and economic development of their Latin American colonies, demanded that cities be planned in a grid-like fashion surrounding a central plaza, with the elite housing closer to the plaza and lower classes on the outskirts.
This layout can still be observed in multiple Latin American cities today. However, as cities experienced rapid urbanization, the CBD developed along the central plaza due to lack of infrastructure on the outskirts. Mass migration and increasing birth rates led to the development of squatter settlements on the outskirts as well.
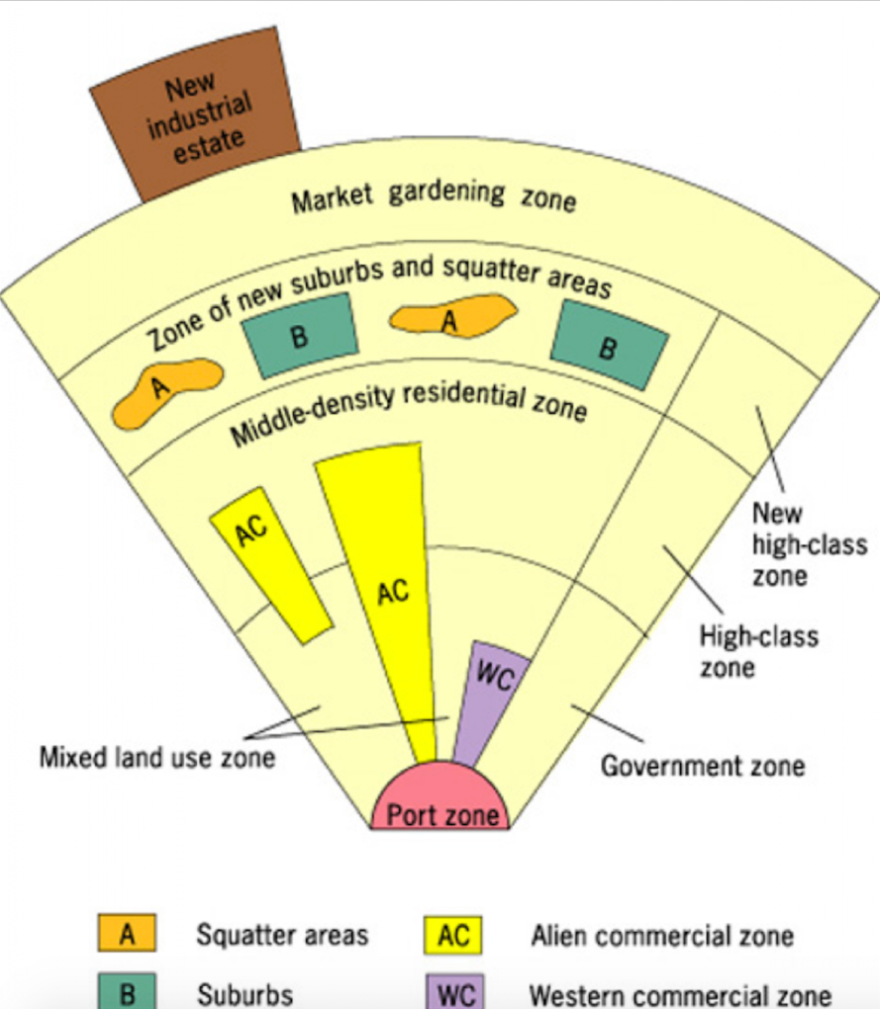
Southeast Asian (SEA) City Model
Proposed in 1967 by T. G. McGee, based on cities such as Jakarta and Kuala Lumpur.
Differs from Western-centric models due to the notion it proposes that the city develops around multiple business districts rather than a single CBD, similar to the Multiple Nuclei Model, as well as the higher-class population living closer to the CBD rather than farther away, as seen in the Latin American model.
The organization of a typical Southeast Asian city is as follows:
Southeast Asian (SEA) City Model
Proposed in 1967 by T. G. McGee, based on cities such as Jakarta and Kuala Lumpur.
Differs from Western-centric models due to the notion it proposes that the city develops around multiple business districts rather than a single CBD, similar to the Multiple Nuclei Model, as well as the higher-class population living closer to the CBD rather than farther away, as seen in the Latin American model.
Port Zone: Functions similar to a CBD, where ships dock and commercial activity takes place. Typically established during colonial times, as several SEA nations were colonies of the British Empire.
Mixed Land Use Zone: A space for both commercial and residential activity. May contain “shophouses”, or buildings with a shop below and the shop owner’s residence above.
Government Zone: Area where government buildings and offices are concentrated.
Western Commercial Zone: Zone where commercial properties owned by Westerners or western trading firms are located.
Alien Commercial Zone: Zone where commercial properties owned by foreigners of other, non-Western nations are located, typically mostly occupied by a large Chinese population.
Middle Density Residential Zone: A smaller population density as compared to the mixed-use zone, typically with larger houses. Contains a high-class housing sector, which expands further outwards into the new high-class zone as inhabitants of the city become richer.
Zone of New Suburbs and Squatter Areas: Area where middle- and lower-class population lives. Unusual compared to other land use models, where the upper class typically inhabit the suburbs.
Market Gardening Zone: Similar to a farmer’s market, containing areas smaller than farms solely dedicated to producing high-value crops which are then sold directly to consumers.
New Industrial Estate: A conglomeration of multiple offices or warehouses centred around a single industry, typically indigenously owned, and designed with the export market in mind.
The design of SEA cities was influenced by port-based economies, with the majority of economic activity concentrated near and around the port zone, as well as the integration of residential and commercial zones occupied by foreign traders into the model.
Furthermore, the design was also influenced by the natural topography of the area. The city expands outwards in wedges as opposed to rings due to being constrained by having the city bordering the sea, preventing it from expanding outwards in all directions.
Sub-Saharan African Urban Land Use Model
Developed by Harm de Blij in 1977.
Differs from Western-centric models due to the notion it proposes that lower-income groups live further away from the CBD, opposing the ideas posed by the Burgess, Hoyt, and Multiple Nuclei models.
The organization of a typical Sub-Saharan African city is as follows: 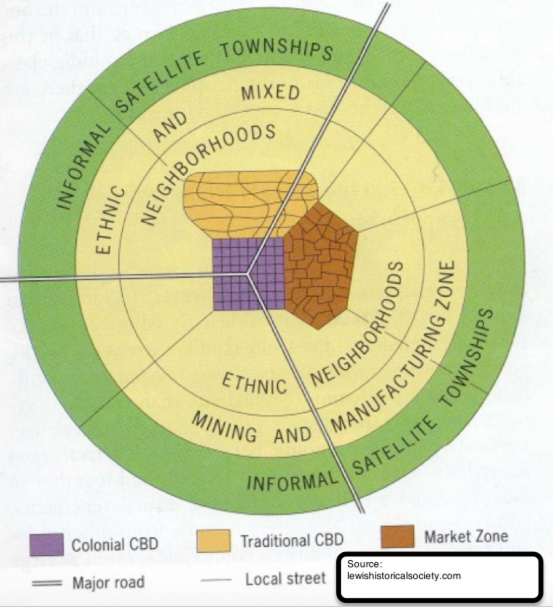
Colonial CBD: Built during the colonial era by European colonizers, and was the commercial hub for European businesses and trading firms. Streets are arranged in a grid-like pattern. The pre-existing infrastructure typically means that the majority of the city’s development is situated here.
Traditional CBD: Typically existed long before colonization occurred, and offers services such as commerce.
Informal Market Zone: Contains informal, unlicensed, open-air markets that are held periodically.
Ethnic Neighborhoods: Neighborhoods in Sub-Saharan African cities are typically separated by ethnicity, with people of the same nationality, race, or tribe often settling close to one-another, reflecting the influence of personal ties on urban land use. Richer cities have residential areas divided by income, similar to cities in the West.
Mining and Manufacturing Zone: The main source of income for several African cities is through their mining industry, which is reflected in the model.
Informal Satellite Townships: Less developed areas where lower-class residents live, often resembling shantytowns and squatter settlements, with houses made out of available materials. Townships expand as larger numbers of people migrate to the city with not enough affordable housing in the city centre, forcing them to settle on the outskirts and resulting in the outwards expansion of the city as a whole.
The design of a typical Sub-Saharan African city is influenced by a variety of factors, such as its colonial past and strong cultural ties.
The infrastructure of the colonial business district is further developed and becomes a zone for government buildings, while strong cultural and ethnic ties result in the separation of ethnic neighborhoods in residential zones.
Indian City Land Use Models
The design and layout of Indian cities is typically influenced by a multitude of factors, the most notable of which being social hierarchy.
People of different castes live in separate, often segregated parts of the city, with those belonging to lower castes often being forced to live away from higher-caste residents.
Cities are typically centered around a historical “core” of sorts– a monument such as a temple or a bazaar.
Rapid urbanization forces cities to expand in haphazard, unplanned ways, resulting in urban management challenges.
Topographic Maps
What are topographic maps?
A topographic map is a flat, 2D map which represents the graphic features on the Earth’s surface, including both natural features such as the terrain, the relief (the variation in elevation and the overall shape of the Earth’s surface), waterbodies, man-made structures, and more.
Common features on a topographic map include:
- Elevation contours: Contour lines on topographic maps connect points of equal elevation. The closer the contour lines are together, the steeper the surface is, as the elevation changes rapidly.
- To make maps easier to read, not every contour line’s elevation is marked. Those whose elevations are given are often made bolder than other lines, and called index contours.
- The contour interval is the difference in elevation between any two contour lines whose elevations are known.
- Symbols: These can be used to represent man-made structures or natural ones. Green is used to indicate vegetation, blue for bodies of water, and black for anything man-made.
- Scale: A ratio of map proportions to real-life ones.
- Grid reference: Used to locate features on the map through coordinates. Consists of a series of two distinct types of lines: easting and northing.
- Easting refers to the distance travelled east from a determined north-south baseline, typically the prime meridian. Distance travelled increases the further east travelled, and goes into negatives if you head west.
- Northing refers to the distance travelled north from a determined east-west baseline, typically the equator or another set baseline. Distance travelled increases the further north travelled, and goes into negatives if you go south.
- When locating areas or structures on the map using easting and northing, you can either use four-digit or six-digit references. Similar to math, the more digits in the reference, the more precise it is.
Use of topographic maps in urban planning:
- Disaster management: Topographic maps are useful in identifying high-risk areas to be affected by a natural disaster, such as during a landslide or a flood, particularly concerning elevation.
- Understanding topography: Urban planners can make better decisions regarding their projects after understanding the terrain they will be working with, such as whether the elevation is appropriate, or whether certain natural features will need to be flattened to create an appropriate surface for construction.
- Military operations: Military operations heavily rely on using terrain, as a higher elevation or the presence of certain natural structures could provide an advantage. Furthermore, awareness of the terrain is required when planning military operations.
Challenges of interpreting topographic maps:
- Obscure symbols: Using symbols other than the conventional ones used to mark man-made and natural structures can create confusion.
- Interpreting contour lines.
- Understanding the scale.
Case Studies:
Gentrification– Cape Town, South Africa:
- Racial and religious discrimination: South Africa’s previously apartheid government which took over the country in 1948 divided the country into various “zones” only certain races or religious groups were allowed to inhabit. An example of this is the neighbourhood of Bo-Kaap in Cape Town, which was previously known as “Malay Town” due to it being primarily inhabited by slaves from Malaysia and India prior to their liberation.
- The apartheid government later forced any non-Malay residents of Bo-Kaap to leave the area.
- Gentrification: Bo-Kaap is an area of historical importance in Cape Town, and its unique architecture, particularly its brightly-painted buildings makes it a high-value real estate location. The abolishment of the Apartheid laws allows foreigners to purchase property in Bo-Kaap, leading to gentrification and a resulting increase in property rates, causing the rent and taxes on surrounding property to increase far beyond what locals could normally afford.
- The houses purchased typically remain empty for large periods of time as well, due to absentee landlordism, further contributing to a lack of available housing in Bo-Kaap.
- Lack of sense of community: Foreigners purchasing and moving into property in Bo-Kaap lack knowledge regarding the local language and culture, disrupting the sense of community.
Gentrification– Brooklyn, New York:
Causes for Gentrification:
- Proximity to Manhattan: Manhattan is New York City’s administrative and economic capital. Brooklyn’s close proximity to Manhattan is partially responsible for driving up property prices and contributing to gentrification.
- Increased cost of living in Manhattan resulted in many residents moving to Brooklyn due to its close proximity, further contributing to gentrification.
- Increased Interest and Demand for Urban Living: Once previously seen as areas of less value compared to the suburbs in the U.S., the 1970’s saw a rise in the appeal and desirability of urban neighborhoods to upper-class, high-income residents.
- Furthermore, young people identifying themselves as “artists” and “hipsters” began to gravitate towards Williamsburg, causing coffee shops, galleries, and other services catering to their demographic to crop up, further contributing to gentrification in the area.
- Real Estate + Infrastructure Investments: Urban renewal efforts such as those undertaken by Robert Moses, an acclaimed American urban planner, contributed to the gentrification of Brooklyn.
- Racial Discrimination Via “Redlining”: Redlining is a discriminatory process through which moneylenders and banks offer minority communities inflated, high-risk loans, taking advantage of the lack of competition in their respective field. As a result, the minorities accepting said loan often struggle with paying it back, forcing them to sell their houses for money or lose possession of them. This allowed private investors to snap up the available property at a low cost and convert it into an urban space more appealing to the upper-class population– a textbook example of gentrification.
Consequences of Gentrification:
Positive:
- Urban Renewal: Infrastructure improves and public spaces become cleaner and safer. Crime rates decrease and the quality of public services increases.
- Economic Growth: Luxury brands are incentivized to open shops in gentrified areas, attracting businesses and customers and promoting economic growth.
Negative:
- Displacement of Lower-Income Residents: Increased property cost, rent, and overall cost of living forces lower-income residents out and makes them move to cheaper areas, with higher-income residents taking their place instead.
- This has been particularly observed in the African-American or Black community, as the Black population in the area has declined by 8.7% in the past decade. This is mostly due to the rising rent costs brought on as a result of gentrification in the area, forcing them to move out and seek housing elsewhere. This is further reinforced by the fact that poverty is increasingly prevalent in Brooklyn’s minority communities, which experience poverty rates between 19 and 26%.
- Displacement of Local Businesses: The increased cost of living results in small, locally-owned businesses often being forced to move to cheaper areas, being replaced by luxury brands, affecting the local identity.
- Social Tension: Increased friction and conflict between newer residents and older ones, affecting the community identity.
Solutions?
- Intervention through Policies: Brooklyn city planning officials can adopt restrictive policies which dictate the strategic use of land within city limits. These policies would dictate that an affordable number of units must be placed within any new building or property constructed, lessening the impact of gentrification. A similar initiative is already being undertaken in New York City.
- Rent regulation is another strategy which must be adopted to remedy gentrification. Limits must be placed on the degree to which a landlord can raise rent. Furthermore, anti-harassment laws must be enforced, preventing landlords from forcing out low-income tenants to rent out property to higher-income ones through measures such as increasing the rent to an exorbitant amount, tampering with locks, calling and knocking, verbal threats, etc.
- To blunt the harm already done to displaced families, affordable housing lotteries can be conducted which favor the former, as well as policies to manage the costs of moving from their old residence to a new one.
- Community Engagement: Residents, both new and long-time, must be consulted when making urban planning decisions. Furthermore, programs to preserve cultural heritage such as small, locally-owned businesses, must be put into action.
Use of Technology in Urban Planning:
Why use technology?
Examples of technology used in urban planning to represent data:
- 3D Models: 3D modelling software such as AutoCAD, Sketchup, and Building Information Modelling (BIM) are often used to construct models of buildings and lay out their design, as well as the processes involved in their construction and final operation.
- 3D models allow city planners to better visualize proposed or new building projects in the context of pre-existing structures compared to 2D maps, as 3D models allow for the simulation of real-world conditions and observation of the consequences of following through with the construction, such as impact on wind flow and traffic, shadows cast by the building, and its aesthetic appeal.
For example, the team behind the Queensland Cross River Rail project used 3D modelling to create a 3D model of the city and the subway to be constructed beneath it. This was used in conjunction with the Unreal game engine, allowing engineers to explore the subway in virtual reality and gain insights into the impact of the construction from a simulated firsthand experience.
Big Data:
The term “big data” refers to vast collections of diverse data that grows at an exponentially fast rate, which are so complex in volume, variety, and velocity at which they grow that traditional data cataloguing systems can’t store, process, and analyze them.
An example of this is data collected in real-time from sensors stationed across an urban area, as well as social media and surveys, such as population growth and density, traffic congestion, land usage patterns, etc.
Data Dashboards:
Though not contributing much to the process of data collection, they display data in easy to interpret forms such as graphs, tables, and heat maps, which are often interactive.
Take, for example, CityDashboard, a site that presents open-source data regarding a variety of cities, such as the weather, views from random traffic cameras, and air pollution, all in a single interface.
Simulations:
Traffic simulations are the mathematical modelling of transport networks in urban areas, which aid in urban planning in a multitude of ways. They can assist in experimental studies, such as the impact of a planned construction on traffic congestion. Furthermore, they can be used to visually illustrate data about traffic and vehicular activity in urban areas.
Certain simulations allow city planners to test the performance of structures in the event of earthquakes, tornados, or other natural disasters, highlighting any design flaws and allowing for the development of a city resilient to natural disasters.
Simulations also allow for Environmental Impact Assessments (EIAs) to be conducted, which allow stakeholders to measure the environmental impact of a plan, policy, or program prior to its actual implementation.
An example of this is Eclipse SUMO (Simulation of Urban MObility), a software used to simulate traffic in transport networks in urban areas.
Examples of additional smart technology used in urban planning:
Drones: Drones play a vital role in urban planning. Firstly, they can be used to measure the environmental impact of a construction, such as by detecting air pollution levels through the use of air quality sensors. Furthermore, they offer a bird’s-eye view of the urban area, providing visual data which can then be mapped onto a 3D model for urban planners to use. Additionally, they can access and collect data from areas that are hard to reach and often hazardous to be in for humans, and provide a clearer image than satellites.
Drones equipped with LIDAR (Light Detection And Ranging) sensors can easily provide visual data regarding the topography of the city and its various 3D structures, aiding in the mapping out of the urban area.
Virtual and Augmented Reality:
Using virtual reality in urban planning can greatly boost community engagement in the planning stage. They allow for a virtual simulation of what proposed constructions would look like in an accessible way, allowing stakeholders with different interests and ideas to all view the changes and propose feedback. Furthermore, a visual representation through virtual reality is easier to interpret for the general public compared to flowcharts, graphs, or other ways, further increasing collaboration between urban planners and residents, and allowing for the development of more inclusive, accessible cities.
Augmented reality, in comparison to virtual reality, is by far more accessible to the general public. The former requires VR headsets, while the latter can simply be used from a mobile phone, boosting community engagement. Furthermore, augmented reality allows urban planners and developers to virtually view how their proposed construction will fit in the context of pre-existing structures.
An example of this is BRISE Vienna (Building Regulations Information for Submission Envolvement) which digitized and semi-automated the entire building permit process by moving to a 3D platform, allowing city planners to visualize how new constructions could affect the urban system.
Internet of Things (IoT):
The Internet of Things (IoT) refers to the network of physical electronic devices which can record and transfer data to one another without human intervention. This is a banner under which several technologies fall under, such as RFID (Radio Frequency Identification) which allows for the tracking of vehicles, aiding in monitoring civilian activity and lowering crime rates. Sensors and cameras present in traffic lights provide real-time data on vehicular movement, helping reduce traffic congestion. Finally, smart lighting automatically dims or brightens light based on activity in the area, not only lowering electricity maintenance costs but also cutting down on light pollution.
An example of this is San Francisco’s SFpark system, which aims to reduce the time spent by drivers searching for open parking spaces. The availability of parking is monitored through sensors in the asphalt of the road, and depending on how full the area is, or whether any special events are happening nearby, the prices of parking meters increase or decrease. All this information is available through the SFpark website and app. It aims to keep at least 15% of parking spaces vacant per block.
The pros:
Accurate Predictions: Technology employed in urban planning makes it easier to collect large volumes of data. As a result, a larger data pool contributes to more accurate predictions as more circumstances and possibilities are accounted for.
Better Visualization and Increased Community Engagement: Technology such as 3D modelling software, virtual reality, and augmented reality helps to better visualize new constructions in the context of pre-existing structures. Furthermore, these visualizations are easier to interpret than maps and flowcharts by the general public, allowing for greater community engagement.
The cons:
Data Privacy Issues: Data collected and transferred through the IoT must be securely encrypted to prevent data breaches by malicious agents.
Expensive Operating Costs: Installing the required hardware is expensive, on top of training personnel to operate and repair said technology.
Unequal Access to Technology: Not all stakeholders have equal access to technology and training on how to properly use it.
Citations:
In-prose citation:
Chalamet remarks, “What utter nonsense.” (11)
Author’s name (Chalamet) mentioned in text itself, page number of source (11) included at the end in parentheses.
In-text citation:
The event as a whole was “utter nonsense” (Chalamet 11)
Author’s name and page number of source included at end in parentheses.
No authors:
Dragons must be fed appropriate quantities of raw meat. (Dragon Care 11)
Title of the text in italics followed by page number. If the text is taken from a chapter of a greater work, in place of the title write the chapter title in quotation marks.
1 author:
(Refer to the example for In-text citation)
2 authors:
The world is changing. (Newland and Kirk 27)
Last names separated by “and”. (No ampersands (&)!!)
3+ authors:
Late night study sessions aren’t advisable a day before exams. Go to sleep. (Colby et al. 195)
Last name of first author followed by et al.
Corporate authors:
Smallpox has officially been eradicated (World Health Organization 87)
Organization name, can be abbreviated if appropriate (Government → Govt., etc.)
Two or more different sources in the same citation:
Some argue that late-night study sessions can be effective. Others vocally disagree. (Key 56; Colby 182)
Author last name and page number separated from other author last name and page number by semicolon.
1 author multiple sources:
Late night study sessions are not only ineffective, but also rob the brain of sleep. (Colby Why You Shouldn’t Study a Day Before the Exam and Go To Sleep)
Titles of both sources (in italics!) following the author's name and separated by “and”.
What is a Population?
Populations are the number of people living in a defined area at a certain point in time. Population growth refers to a change in the number of people over a specified period of time.
Factors Affecting Population
- Birth Rate: The number of live births per 1000 people per year. Typically low in developed countries, and high in developing countries.
- Death Rate: Number of deaths per 1000 people per year. Has since declined globally due to improved healthcare facilities.
- Migration: The mass movement of people from one location to another. Can be internal (within a country) or international (between countries). Occurs due to a number of push (factors that make people leave a country) and pull (factors that make people want to move to a country) factors.
Impact of Migration
Emigration: Refers to the act of leaving one’s place of residence to settle elsewhere.
Immigration: Refers to the act of moving to another country of which one is not a permanent resident with the intent to permanently settle down for a period of time.
Migration is a huge contributor to population growth, with economic development and resource allocation being affected as a result, boosting the demand for sustainable urban planning.
Types of Migration
- Voluntary: Migration based on the migrant’s own choice, free will, and initiative.
- Involuntary: Migration against the migrant’s choice, usually forced by factors such as war.
- Seasonal: Occurs based on seasonal or yearly events, such as harvests or agricultural work.
Impact on the Country of Origin
Positive:
- Remittance: Sums of money sent home by migrants abroad to their remaining family, boosting the economy.
- Training: Migrants gain advanced skills abroad, which can help them take higher-paying jobs in their country of origin if they return.
Negative:
- Brain drain: Skilled personnel migrate to other countries, depriving their birth country of skilled workers.
- Family separation: Migrants are separated from their families, impacting mental health and wellbeing.
- Urban decline (internal migration): Large numbers moving from rural to urban areas can leave rural areas abandoned, eventually leading to urban decline or ghost towns.
Impact on the Host Country
Positive:
- Growth of labour force
- Cultural diversity
- Economic growth (labour and consumption)
Negative:
- Increased inequality
- Discrimination
- Strain on resources and social welfare system
Push and Pull Factors of Migration
Push Factors (drive people to leave a place):
- Economic: Poverty and lack of job opportunities.
- Geographic: Natural disasters, climate change (especially rising sea levels), and a lack of natural resources.
- Political: War, political corruption, lack of freedom, or political instability.
- Socio-cultural: Discrimination, persecution, or lack of social services.
Pull Factors (drive people to move to a place):
- Economic: Better quality of life and greater availability of jobs.
- Geographic: Better climate and more available natural resources.
- Political: Politically stable, lack of corruption, and safe.
- Socio-cultural: Safe, better social services, and more acceptance and diversity.
Population Distribution vs. Population Density
Population distribution: How people are spread out across the world. Worldwide, it is uneven and influenced by a combination of physical and human factors, with a high population in urban areas.
Population density: The number of people per unit area (measured in sq. km). It is calculated by dividing the total population by land area and is a measure of how crowded a place is.
Population Pyramids
Population demographics can be illustrated through a type of graph called a population pyramid. They are typically used to view the composition of a population in terms of age. The various age brackets are written on the y-axis, with younger ages on the bottom, while the percent of the total population of people in said age bracket makeup is written on the x-axis.
Types of Population Pyramids
- Expansive: These pyramids have a broad base and narrow top, indicating a large population of young people and a small aging population. This signifies high birth and death rates, as people die young. Commonly observed in LEDCs, and implies a high dependency ratio as there are multiple young people dependent on older ones. This is caused by both a lack of access to contraceptives and sex education, as well as a cultural preference for large families.
- Stationary: These pyramids are uniform and relatively even, observed in MEDCs.
- Contractive: These pyramids have a narrow base, indicating a small population of young people and a large aging population. This occurs due to low birth rates and a long lifespan, as well as more access to contraceptives and sex education. Furthermore, this could indicate a larger percentage of women in the workforce, and access to better healthcare as a whole.
Demographic Transition Model (DTM)
The demographic transition model illustrates and explains changes in population over time, as influenced solely by birth and death rates, excluding migration. It consists of five stages, with each stage corresponding to a level of development.
Stages of the DTM
- High Stationary: Presents high birth and death rates, with slow overall population growth. Observed in pre-industrial agrarian societies, with no country currently in this stage. Large families are created for survival and labour. Despite high birth and death rates, a few children survive to adulthood. More children also allow for child labour.
- Early Expanding: High birth rates and rapidly falling death rates, resulting in rapid overall population growth. Observed in early industrial societies, caused by improvements in healthcare. Birth rates remain high due to the above reasons and lack of access to contraception.
- Late Expanding: Declining birth rate along with low death rate, with moderate population growth. Birth rates decline due to greater access to family planning and contraception. Associated with high urbanization and large numbers of women in the workforce.
- Low Stationary: Extremely low birth and death rates, with population growth stabilizing and fluctuating. Commonly observed in high-income, late industrial societies.
- Declining: Birth rate is lower than death rate, population begins to decline. Results in an aging population and high dependency ratio, with many elderly relying on younger workers. Population replacement rate is unsustainable, workforce shrinks, and healthcare costs rise. Observed in post-industrial societies. Can be mitigated through immigration and automation.
Drawbacks of the DTM
- Fails to account for migration
- Doesn’t acknowledge cultural and historical context
- Doesn’t consider modern healthcare
- Fails to consider rapidly changing economies in the 21st century
Gender Inequality and Population Change
Population change refers to an alteration in the size, structure, and distribution of a population. It can be influenced by a natural increase in the number of children born each year. This is frequently observed in LEDCs as compared to MEDCs. It can also be influenced by migration, pro- or antinatalist policies and legislation, or even urbanization, as households living in urban areas typically prefer having few or no children.
This, in turn, affects the job market as the number of people available to work decreases. Furthermore, a rapid population decline results in a high dependency ratio due to a large aging population, further straining healthcare and pension systems.
This all affects natural resource availability and land use, resulting in more resources and land being used to meet the needs of a growing population.
Gender inequality refers to the unequal treatment or perception of individuals based on gender. This results in unequal access to healthcare, education, and economic opportunities, as well as the under-representation of women and gender-based violence and discrimination.
This is caused by misogynistic cultural norms, economic barriers, flaws in the institution and exclusion of women from political spaces, as well as higher rates of child marriage and death in childhood.
Though more of a correlation than a causation, higher fertility rates correspond to higher rates of gender inequality.
This can be fixed through female education, strengthening legal protections for women, and raising awareness.
Important Formulas and Terminology
- The general fertility rate is the number of live births per 1000 women of reproductive age (15-49 years) in a given year. The minimum reproductive age is so low due to low ages of consent in certain countries.
Formula: Total Live Births / Number of Women * 1000 - The total fertility rate is the average number of children a woman would have during her lifetime based on current age-specific fertility rates.
- The replacement fertility rate is the total fertility rate required for a population to replace itself from one generation to the next, excluding migration. Ideally, it should equal 2.1 kids per woman, anything less would result in population decay.
- The sex ratio is the ratio of males to females in a population per 1,000 females. However, this is reversed in India, with the sex ratio being the ratio of females to males instead due to the severe infanticide and foeticide of female babies and fetuses in the country. It is used to measure demographic balance and depends on various social and cultural features.
Formula: Number of males / Number of females * 1000 (reverse for India!) - Primary: Sex ratio at conception.
Secondary and Tertiary Sex Ratios
Secondary: Sex ratio at birth.
Tertiary: Sex ratio for a population of specified age.
The fertility rate is the average number of children that would be born to a woman over her lifetime.
The infant mortality rate is…
Formula: Number of dead infants (children under the age of one year) / Number of total live births * 1000
Case Studies
Boosting Birth Rates – Pronatalism in France and African Nations
What is Pronatalism?
The term “natalism” comes from the French word for birthrate, “natalite”, and refers to any policies or personal attitudes that are “pro-birth”, encouraging reproduction, glorifying the roles of parenthood and child rearing, and promoting a high birth rate.
Overall Benefits of Pronatalism
- Political and Cultural: Pronatalists believe that high birth rates and a growing population are essential to maintain the world’s population, ensure enough workers to fill the demand for jobs and thereby support economic growth, as well as preserve national and cultural identities, i.e. cultures or countries “dying out” because fewer and fewer people practicing that culture or belonging to that country are being born.
- Economic: Parenthood is incentivized financially through a multitude of ways. Families with multiple children receive tax breaks, affordable or even free childcare, as well as maternity leave, alongside subsidized (subsidy meaning a grant of money given by the state or a public service to help keep the price of a commodity low) education and housing.
Overall Drawbacks of Pronatalism
- Cultural: People who are childfree, either by choice or otherwise, may feel isolated and invisible in a pro-natalist world. They may even be shamed for not having children, resulting in a devastating psychological impact.
- Social: Women have historically been responsible for childbearing and child rearing, typically being relegated to the home and household duties and restricted from pursuing further opportunities or careers. An increased focus on childbearing and raising children will force women back into their domestic roles and reinforce traditional gender roles. Furthermore, government policies restricting abortion or access to contraceptives can infringe women’s rights and bodily autonomy.
- Economic: Women being forced to take on domestic duties and raising children limits the number of women in the workforce, shrinking the labour market.
France’s History of Pronatalism
Code De La Famille (1939)
On the 16th of January, 2024, French president Emmanuel Macron vowed to extend parental leaves and promote IVF (in-vitro fertilization) programs in a press conference held the same day, calling infertility the “taboo of the century”.
This is by no means new– historically speaking, France has long since been a natalist nation.
Its historically natalist stance emerged due to the combined influence of religion and competition with Germany, thanks to the First and Second World Wars.
France lost 10% of its active male population in World War I. Men who didn’t die were still away at war, and hence, a scarce number of children were born during that time, with France’s population dropping by 3 million people. In response, a pro-natalist organization by the name of the ANAPF (National Alliance for the Growth of the French Population) enforced a law by July of 1920 that limited access to abortion and contraception. Furthermore, believing that women having access to rights previously unavailable to them made them unwilling to have children, as seen in other countries in the West, the ANAPF blocked legislation that could have given women the right to vote earlier in the 1920s.
Primary incentives include the Medaille de la Famille française developed in 1920 (Medal of Honour of the French family), a medal awarded to parents of large families for “raising their children well”, on the account that they have at least four children, with their eldest being 16.
Next came the Code de la Famille– a pro-natalist legislation passed in 1939, which contained multiple policies aimed to incentivize people to have more children. Said policies could be summarized as:
- A ban on the sale of contraceptives, which was later repealed in 1967 to stop the spread of STDs.
- Financial incentives to households with additional children.
- And subsidized leave and holidays.
To expound on the latter two, a decent number of incentives benefitted both parents, such as:
- Grants of up to 1064 euros to households having their third child.
- A 30% reduction in public transport fare for all three-child households.
- Childcare that cost almost nothing, at most being 500 euros.
- And tax benefits for both the mother and father till their youngest child hit 18.
Meanwhile, others were aimed at the mothers themselves, offering reduced hours or an additional holiday from work for nursing mothers, financial grants for maternity leave, and maternity leave itself for up to 20 weeks for a woman expecting her first child, and 40 for one expecting her third.
Furthermore, French households with a single, typically-male breadwinner were and still are awarded a “Housewife’s Allowance” or “Family Allowance”, with the criteria for eligibility only being that you were a) a French citizen, and b) had at least 2 children. This was introduced to promote women, who were typically in charge of child rearing at the time, to stay at home and follow the path of traditional housewives rather than consider alternative uses of their time and skills.
As a result, the participation of French women in the workforce was relatively small, up until the mid-1960’s, which was when the feminist movement hit France hard, dismantling the grip that traditional gender roles had on the state.
However, the pronatalist policies that were introduced later completely rewrote the narrative regarding France’s stance on the issue, as rather than attempt to force women back into traditional gender roles, schemes were adapted to accommodate working women, with a growing emphasis on the opening of creches and childcare facilities.
As a result, in the 1950’s and 60’s, France’s population increased on an average of 1% per year– the highest observed in the country’s history.
From the 1980’s to 1999, the number of creches in France has increased on average per year by 64,000, eventually reaching a total of 201,000 by 1999. Additionally, in 2002, around 9% of children were cared for by creches.
Policies also shifted away from traditional, two-parent households to single-parent ones, with the introduction of welfare supplements such as the API (Allocation de parent isolé), a yearly allowance paid to parents in single-parent households till their child turns three years old.
France is a Stage 4, or Low Stationary country according to the Demographic Transition Model (DTM), characterized by a stable population increase, as well as low birth and death rates. Much like its other European neighbours, it's well on the way to becoming a Stage 5 country considering the fact that the death rate has exceeded the birth rate.
Pronatalism also aided in the decline of France’s previously prevalent eugenics movement. Eugenics is a social movement that aims to “improve” the human race through selective breeding, ensuring that undesirable traits die out while desirable ones are passed on down to the next generation– a disgusting practice that has its roots in Nazi ideology, a.k.a Hitler’s whole “Aryan race” dialogue.
France’s concerns regarding population decline outweighed any “pros” that adopting the eugenics movement had, particularly after World War I. Eugenics was further pushed out of people’s minds thanks to the various pronatalist policies implemented in the 1930s, like the Code de la Famille.
Pronatalism and Feminism
France’s pronatalism movement has had a messy relationship with the feminist movement led by influential figures like the philosopher Simone de Beauvoir, author of The Second Sex. Feminists called the government’s pro-natalist policies “forced motherhood”.
A name that frequently crops up in the history of French feminism is the Mouvement de libération des femmes, or the Women’s Liberation Movement, abbreviated to the MLF.
Abortion in France was illegal till 1975, resulting in hundreds of women resorting to illegal, unsafe, and often fatal abortions done outside of hospital settings instead. The MLF played a key role in campaigning for the legalization of abortion in the 1970s, with their efforts eventually culminating in the Veil Law, named for the lawmaker Simone Veil, which decriminalized the termination of pregnancy for all French women up to 10 weeks of gestation if they could appropriately justify how carrying the pregnancy to term was causing them “distress”.
The Neuwirth Law legalized the nationwide sale of contraceptives again in 1967 after its initial ban in the 1940s. The legalization of contraception was seen by feminists as a symbol of female liberation– contraception was “a new liberty” for women. Prior to its legalization, however, the MPF would hand out contraceptives secretly, though the significant cost of doing so meant that they could only reach the educated middle class, limiting their impact.
However, France was only “pro-natalist” when it came to the mainland. Where the DOMs, or Departments d'outre-mer, a.k.a their overseas territories, France was incredibly anti-natalist.
These anti-natalist tendencies came less from a place of concern for women, and more from one of racist ideology.
One of France’s biggest overseas territories is the Antilles, a group of islands in the Caribbean Sea. The inhabitants of the Antilles were considered French citizens but typically came from Dominican or Haitian descent, making them the victim of the racist policies directed against them by the French government.
Propaganda regarding the Antilles was common in France, often sexualizing the residents of the area and degrading them to offensive and inaccurate stereotypes. Furthermore, misinformation regarding a high female-to-male sex ratio in the area ran rampant throughout the mainland, not helping the image of the Antilles at all. French officials used this to their advantage to call the people “unhygienic” and possessing “loose morals” when it came to reproduction.
Two anti-natalist policies can be most clearly observed.
Firstly, families in the DOMs were provided with less financial support for having children compared to families in France. The family allowances were introduced only partially in the Antilles, they were dependent on having at least one parent working, and were even lower for the third child and onwards.
An article in a French magazine published in 1972 called out this behaviour; “In the DOMs, you practice forced sterilization and promote free use of contraception from the age of fifteen. In France, you refuse it under 21. Why? Because the colonial administrators for the moment are more invested in white procreation than black procreation.”
Successes of France’s Pro-natalist Movement
Social: The Code de la Famille does not favour any gender, nor does it show bias towards two-parent households over single-parent households. Furthermore, it doesn’t reinforce traditional gender roles that women were forced to play, as the dirt-cheap childcare services offered allow women to continue working while still raising a child.
Furthermore, France’s fertility rate has increased from 1.67 in 1998 to 1.98 in 2015.
Finally, having a stable birth rate that doesn’t decline across multiple generations results in less of a generational disconnect between the old and young, promoting social cohesion.
Political: France’s current population is 66 million people. Without the various pronatalist policies implemented, it would have been anywhere between 56 to 61 million people, which is approximately 5 million French people who never would’ve been born, if we’re going on the upper limit.
Cultural: Maintaining a French population is crucial to ensuring French culture does not die out. If the population continues to shrink, then there will come a day where no more native French people are born, resulting in the loss of French culture and language.
Economic: Having a large population ensures a growing workforce, with sufficient people to fill in the empty positions created by the job market and generate revenue for the country.
Additionally, the resources and services required to appropriately raise a child till adulthood drive the parents to spend money, further resulting in more participation in the economy, as well as opening up jobs in the childcare industry, such as jobs like nannies, schoolteachers, babysitters, and more.
Failures of France’s Pro-natalist Movement
As of 2020, only 740,000 babies were born in France– the lowest number since World War II, which was when the Code de la Famille was implemented.
Furthermore, the decline in birth rate isn’t exclusive to France, but rather, a global trend owing to urbanization. If anything, it’s the mark of a developed, modern nation that people are having fewer children.
Following up with the feminist movement in the 60’s, French women have had an increasing number of opportunities open up to them. While this means that children of either gender being born will have a good chance of living a comfortable life, this also results in a growing “opportunity cost” of having kids– adults, particularly women, now have better things to do than care for and raise children.
Social: The overall success of the Code de la Famille has recently been difficult to evaluate due to France’s enshrinement of abortion as a constitutional right in 2024. Current fertility rates have dropped as a result.
Gender equality is also a major problem as the push for more children can shape women into taking on traditional roles in the family such as, prioritizing family and motherhood instead of a career.
The biggest social problem from pro-natalist policies is overpopulation. Increased fertility rates can lead to a huge boost in population which can greatly impact the country if not managed properly. Already, major cities like Paris, have problems related to housing, and overcrowded homes can become huge issues in France.
Economic: Continuing to fund the services and schemes associated with the Code de la Famille is a massive economic drain on the French government’s federal budget, forcing them to take alternative measures such as raising the retirement age from 60 to 62 in 2018, to ensure a greater economically active population that can care for the elderly and aging.
Political: Despite the numerous pronatalist policies implemented in France, the current French fertility rate is only 1.64 births per female, which is well below the ideal replacement ratio of 2.1. This, in combination with the baby boom in the 1960s, when France had a fertility rate of 2.75, means a greater aging population for the generations of today to look after.
Health: Though since discontinued, the brief ban on contraceptives as declared in the 1939 version of the Code de la Famille contributed to the spread of sexually-transmitted diseases, or STDs.
Furthermore, the Covid-19 pandemic of years past led to several people choosing not to have children, out of fear for the future, or of infecting their babies with the disease, further contributing to declining birth rates.
History of Pronatalism in Africa
The policies originated in Africa because the region wants large families to provide economic and social security. National identity development and workforce expansion became key factors for post-colonial governments when they promoted high birth rates. Nations such as Kenya together with Nigeria displayed high fertility rates because both territories had limited contraception access at the same time as traditional social practices sustained these trends. Numerous countries are moving away from unbalanced policies and addressing both urbanization problems and resource limitations.
Curbing Child Creation– China’s One-Child Policy
Proposed in: 1979
Ideology behind it: Having too many people results in a poor quality of life, hence, population control is required.
Historical context: The previous leader of China, Mao Zedong, greatly emphasized population growth and having more children, as he believed it to be an indicator of national strength and contributed to a stronger workforce. Furthermore, following World War Two, the population skyrocketed from 540 million people at the end of the war to 960 million in the 1970’s.
Policies: Slogans such as “have fewer but better children”. Forced sterilization and abortions. Households are only allowed to have a single child. Prior to the official implementation of the policy, couples were encouraged to have children later in their childbearing years.
In 1973, the National Family Planning Committee developed the slogan “Wan Xi Shao”, which roughly translated to “Later, Longer, and Fewer”, encouraging people to have kids later in life, wait longer between having children, and have fewer kids overall. This slogan was eventually abolished in 1979.
Since they couldn’t directly force families to follow the one-child policy, the government instead tried to appeal to their emotions. They emphasized family bonds, such as how the bond between parent and child would be stronger with only a single child in comparison to multiple children, the latter diverting the parent’s attention constantly.
Reception: Better received by urban city-dwellers in China in comparison to those who lived in rural areas due to a preference for a male child to continue the family line. Furthermore, living conditions in the city were already crowded and cramped, with people suffering from housing shortages and not too willing to procreate. Eventually, the law was relaxed on rural people, who were allowed to have a second child if the first one was a female.
Proponents of the policy called it a “necessary move”. The West viewed it as a harsh, controlling, and downright barbaric policy, due to the U.S.’s dislike for and competition against China for control over the Asia sector.
Singapore adopted a similar policy, encouraging families to stop at having two children, taxing those who chose to have more. Eventually, this policy, too, was reversed when the population began to decline as well.
Positive Impacts:
- Having fewer children results in less strain on resources. Families saved more on expenses and could thereby invest more money into a better quality of life.
- Having less children also resulted in a small dependency ratio, with more skilled people available to enter the workforce.
- Households who complied with the law received social benefits.
- Despite the later gender imbalance created by the number of female abortions and infanticide occurring, more women were able to enter the workforce thanks to the one-child policy.
- Families who already had daughters or didn’t care too much about the gender of their child focused their finances on educating their female children instead of having more babies in the hopes of producing a son, boosting female literacy rates.
- It was also an attempt to boost the wealth of individual households. Rather than spreading their budget thin over multiple children, parents were encouraged to concentrate what they had on a single child, setting them up for success later in life.
Negative Impacts:
- The preference for a male child in rural areas resulted in a large number of female abortions and infanticide, contributing to a huge gender imbalance in China.
- The rate of population growth reduced from 15 people per 1000 people in 1980 to barely 5.5 people per 1000 people today.
- Households who did not follow the law had to go through forced abortions and sterilization as well as social exclusion.
- In the long-term, the policy resulted in a large aging population, a smaller workforce, along with immense pressure on the single child produced to do well in life.
- Families were charged a “social maintenance fee” for having more than 1 child. According to the law, families who had an extra child created an additional “burden” for society. Thus, the money collected through the fee would be used for the operation of the government. If the family was unable to pay the fee, their child would be denied a hukou, a legal document required to marry, receive healthcare, or go to government schools.
- After the birth of the first child in the 1980s, women were made to place an IUD four months after the delivery, or men were sterilized. Further lack of compliance with the law resulted in mandatory sterilization after the birth of the second or third child in 1983.
Repealed in: 2015, subsequently replaced with the two-child policy the same year, and the three-child policy in 2021. Later in 2021, the three-child policy was abolished entirely, with people allowed to have as many children as they wanted. The government even went as far as to promote multiple births.
In 2015, the CCP abolished the one-child policy, citing the intent to deal with the nation’s aging population as well as remedy the skewed sex ratio of males to females.
An American news agency said that the relaxation of the family policies did not mark the end of the authoritarian regime in China, and that the state was only adjusting the policy to meet current conditions. If anything, the fact that the state itself had chosen to govern the number of kids a person could have was still a sign of its power.
The United Nations predicted that China would lose 67 million working-age people by 2030, with the number of elderly nearly doubling. By 2050, it was predicted that one-third of the country would be aged 60 years or older, with an even smaller number of working people to support each aged individual.
As of 2024, China’s fertility rate has reduced to 1.0– dangerously below the minimum replacement rate of 2.1.
However, contrary to what the CCP intended, removing the one-child policy will not lead to the baby boom it desires. Fertility rates naturally decline the more developed a country becomes. China has seen rapid development, with a huge amount of urbanization occurring in the country. Couples choose to have fewer children the further they move into the city, as well as when women choose to enter the workforce as opposed to domestic labour.
Giving Girls the Chance to Grow– India’s Beti Bachao, Beti Padhao Program
Proposed in: 2015, Panipat, Haryana
Ideology behind it: Haryana was a state notorious for its low sex ratio of female children to male children.
Historical context: Historically, India’s sex ratio has been extremely low, going from 978 females per 1000 males in 2001 to only 918 females. Furthermore, Beti Bachao Beti Padhao was the first in a long line of schemes aimed at boosting India’s sex ratio, such as the Pre-Conception and Pre-Natal Diagnostic Techniques Act of 1990.
The natural sex ratio at birth (SRB) was estimated to be approximately 950 girls per 1000 boys. However, India’s SRB between 2018 and 2020 was only 907 girls per 1000 boys– incredibly low, compared to the average.
Even when considering just single-child families, the ratio of single-daughter to single-son families was 514 single-daughter families to 1000 single-son ones. This ratio is especially terrible amongst joint families living in rural areas, particularly in the north of India.
The main reason behind the immense preference for a male child over a female one was the practice of dowry. Dowry refers to a payment of either money, physical assets, or land to the groom’s family from the bride’s family after the bride is married. For families living in rural areas, dowries took a huge toll on their finances, especially those with multiple daughters. Hence, a male child was preferred.
Policies
Balika Samridhi Yojana: A financial scheme that covers girl children in families below the poverty line in both urban and rural areas. These children are bestowed a R.s. 500 grant after their birth, as well as annual scholarships for their education.
Ladli Lakshmi Yojana of Madhya Pradesh: Another financial scheme focusing on the state of Madhya Pradesh in particular, that covers the costs of the child’s education for girl children in families before the poverty line. Money is paid in varying installments to the girl till she reaches 21 years of age. Girls who drop out of school are no longer eligible for the scheme, as are girls who are married before they reach 18 years of age, and the scheme only applies for two girl children.
Mukhyamantri Rajshri Yojana of Rajasthan: A financial scheme focusing on the state of Rajasthan, which covers the costs of the girl child’s education for children in families below the poverty line till she graduates from 12th grade. The child must be a resident of Rajasthan and be born in a government or private hospital. The scheme itself as a whole is applicable only for up to 2 girl children.
Ladli Scheme of Delhi: A financial scheme focusing on the state of Delhi which covers the costs of the girl child’s education and provides a monetary grant to the family upon the child’s birth till she graduates from 12th grade. The scheme applies to girls born in both government hospitals as well as delivered at home.
Kanyashree Prakalpa of West Bengal: A financial scheme focusing on the state of West Bengal which aims to prevent child marriage by keeping girls in school. It does so by providing unmarried girls aged 13-18 with a scholarship of R.s. 1000 to girls still enrolled in school for each year they spend in school, and a final monetary grant of R.s. 25,000 when they turn 18 years old as long as they are unmarried and engaged in academic pursuits.
Positive Impacts
The sex ratio increased from 918 females per 1000 males in 2011 to more than 930 females per 1000 males in 2015.
Negative Impacts
However, many issues still persist despite BBBP– the National Crime Record Bureau (NCRB) has remarked on the underreporting of rape crimes from women. Furthermore, India’s Female Labour Force Participation Rate (FLFPR) is still below the global average of 47%.
Furthermore, the scheme as a whole was rendered ineffective due to the poor allocation of funds set aside for it. The Indian government spent the majority of the budget in advertising and marketing the scheme in place of launching initiatives in the healthcare and education sectors.
In 2021, in Lok Sabha, 78.91% of the funds allocated for Beti Bachao Beti Padhao were used for ads.
In 2016 and 2017, the Parliamentary Standing Committee on Human Resource Development mentioned that only R.s. 5 crore of a budget of R.s. 44 crores allocated for the scheme was utilized properly.
Finally, the Comptroller and Auditor General (CAG), the office in charge of auditing government expenditure, of India has concluded that the scheme failed to meet its goals, as the sex ratio had continued to further degrade in parts of Haryana and Punjab.
Biomes
A biome is a large geographic region characterized by the animal life, vegetation that has developed in response to abiotic factors such as climate, soil type, elevation, etc. Biomes are affected by factors such as climate and temperature.
An ecosystem (ecological system) is formed through the interaction of organisms and their environment, characterized by the flow of energy between biotic and abiotic factors. Ecosystems aren’t directly affected by climate and temperature.
Biotic factors are the living components of an ecosystem, such as the autotrophs (producers like plants and algae), heterotrophs (primary, secondary, and tertiary consumers), and detritivores (insects) and decomposers (fungi, bacteria).
Abiotic factors are the nonliving components of an ecosystem, such as the rocks, water, soil, temperature, etc.
Biomes can either be terrestrial or aquatic. Terrestrial biomes include:
- Grasslands: These biomes are found between the temperate and torrid zones, and consist mainly of grass as vegetation, with a few shrubs and trees. These biomes experience extreme temperatures (hot summers and cold winters).
- Temperate Deciduous Forests: As the name suggests, these forests are found in the Earth’s temperate zones. These biomes experience four distinct seasons, with the trees shedding their leaves once a year during fall.
- Deserts: These are biomes that receive the least amount of precipitation, and as a result are very dry. They can be hot (the Sahara desert) or cold (Antarctica). The primary form of vegetation in hot deserts are cacti and a few shrubs, with the majority of flora and fauna evolving to store water or survive without it for a long time.
- Tundras: Biomes characterized by cold temperatures, permafrost covering the ground, and a lack of vegetation save for lichens with a short growing season.
- Taigas: Taigas, also known as boreal forests, are forests whose primary vegetation consists of evergreen trees such as pines, spruces, and other conifers.
Forests
These biomes are characterized by their main form of vegetation being trees. Forests cover one-third of the Earth’s land surface. Forest biomes can be temperate, tropical, and boreal.
Tropical forests: As the name suggests, are generally found in the area between the Tropics of Cancer and Capricorn. They encompass a variety of forest types, including rainforests.
Tropical Rainforests
These biomes typically occur near the equator, in areas with high precipitation. These biomes are characterized by the various “layers” of vegetation present.
Tropical Rainforest Layers
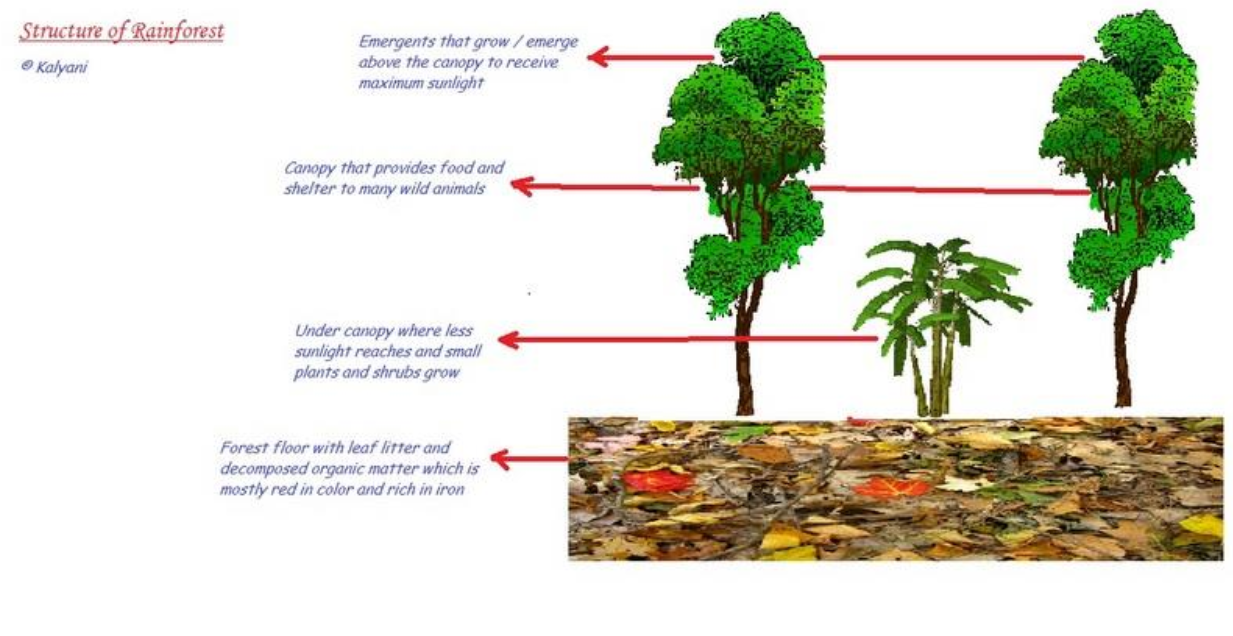
The canopy layer consists of the topmost branches of the trees in the rainforest. The emergents are branches of trees that grow above the canopy to receive more sunlight. The under-canopy receives less sunlight, facilitating the growth of only smaller shrubs and trees. The forest floor receives almost no sunlight, and contains dead or decaying organic matter.
Rainforests are under threat from logging and agriculture. Logging is the practice of harvesting, cutting, and transporting trees. Rainforests are especially threatened by this as they contain lots of trees and vegetation. Illegal logging practices include cutting down more than the allotted quota of trees, cutting down rare or endangered species, and cutting down trees on indigenous land.
Importance of Rainforests
- Environmental:
- Carbon sink: Rainforests are massive carbon sinks, with trees absorbing carbon dioxide to use in photosynthesis, and emitting oxygen which other living organisms require.
- Habitat for animal and plant species: Rainforests are what thousands of animal and plant species call home, with multiple new species being discovered each year.
- Evapotranspiration: Rainforests return water vapor to the Earth’s atmosphere through evapotranspiration, promoting precipitation.
- Sociocultural:
- Important to indigenous peoples: Rainforests are home to a multitude of indigenous peoples, such as the Yanomamo and Kayapo.
- Economical:
- Timber: Trees from the rainforest are cut down and used as timber, making logging one of the greatest threats to rainforests.
- Pharmaceuticals: Around 25% of all Western drugs are derived from plants in the rainforest, making it an important supplier of the pharmaceutical industry.
Amazon Rainforest
The Amazon rainforest is the world’s largest tropical rainforest, covering around 6.7 million square kilometers. It stretches across nine countries, and is home to thousands of animal and plant species.
It is mainly threatened by deforestation, particularly due to logging. During the 1960’s, farmers used the slash-and-burn farming technique, which involved cutting down the vegetation in the area, leaving it to dry, and eventually burning it, to create a layer of nutrient-rich ash that boosts soil fertility. However, this effect is only temporary, with soils losing their productivity in just 3-5 years, forcing farmers to move further inland and clear out more jungle.
The presence of fossil fuel reserves in the Amazon rainforest has also led to an increase in mining and oil drilling activities in the area, damaging the forest.
The rainforest is also responsible for the precipitation in the area through evapotranspiration, with deforestation and loss of vegetation in turn causing a lack of rainfall.
Conservation Measures
- Non-Governmental Organizations: NGOs such as the Rainforest Trust and Fundacion Natutama play huge roles in protecting the rainforest.
- The Rainforest Trust aims to declare endangered parts of the rainforest as legally-recognized protected areas by either purchasing and maintaining the land themselves, making it a national park, or giving the local indigenous population the rights to and legal ownership of said land. This has been incredibly effective, as 99% of the rainforest that was once under endangerment continues to remain protected even after the Rainforest Trust ceased to completely protect them.
- Fundacion Natutama aims to educate the local population, particularly the younger generation, about how to sustainably manage and live alongside the rainforest. They also regularly monitor the populations of rainforest flora and fauna to identify any threats affecting them.
- Sustainable Forestry: This includes practices such as afforestation and selective logging. With the former, logging companies are made to replant whatever trees they cut down, while with the latter, they are only allowed to cut down a small portion of trees, to allow the forest to naturally replenish itself. Selective logging means logging companies harvest less timber, but is cheaper in the long run, as they don’t have to spend money replanting trees.
- Law Enforcement: Several of the logging and mining operations that threaten the Amazon rainforest are illegal. Hence, introducing stricter measures against such crimes are necessary to protect the Amazon rainforest.
Tropical Rainforest Layers
The canopy layer consists of the topmost branches of the trees in the rainforest. The emergents are branches of trees that grow above the canopy to receive more sunlight. The under-canopy receives less sunlight, facilitating the growth of only smaller shrubs and trees. The forest floor receives almost no sunlight, and contains dead or decaying organic matter.
Rainforests are under threat from logging and agriculture. Logging is the practice of harvesting, cutting, and transporting trees. Rainforests are especially threatened by this as they contain lots of trees and vegetation. Illegal logging practices include cutting down more than the allotted quota of trees, cutting down rare or endangered species, and cutting down trees on indigenous land.
Importance of Rainforests
- Environmental:
- Carbon sink: Rainforests are massive carbon sinks, with trees absorbing carbon dioxide to use in photosynthesis, and emitting oxygen which other living organisms require.
- Habitat for animal and plant species: Rainforests are what thousands of animal and plant species call home, with multiple new species being discovered each year.
- Evapotranspiration: Rainforests return water vapor to the Earth’s atmosphere through evapotranspiration, promoting precipitation.
- Sociocultural:
- Important to indigenous peoples: Rainforests are home to a multitude of indigenous peoples, such as the Yanomamo and Kayapo.
- Economical:
- Timber: Trees from the rainforest are cut down and used as timber, making logging one of the greatest threats to rainforests.
- Pharmaceuticals: Around 25% of all Western drugs are derived from plants in the rainforest, making it an important supplier of the pharmaceutical industry.
Amazon Rainforest
The Amazon rainforest is the world’s largest tropical rainforest, covering around 6.7 million square kilometers. It stretches across nine countries, and is home to thousands of animal and plant species.
It is mainly threatened by deforestation, particularly due to logging. During the 1960’s, farmers used the slash-and-burn farming technique, which involved cutting down the vegetation in the area, leaving it to dry, and eventually burning it, to create a layer of nutrient-rich ash that boosts soil fertility. However, this effect is only temporary, with soils losing their productivity in just 3-5 years, forcing farmers to move further inland and clear out more jungle.
The presence of fossil fuel reserves in the Amazon rainforest has also led to an increase in mining and oil drilling activities in the area, damaging the forest.
The rainforest is also responsible for the precipitation in the area through evapotranspiration, with deforestation and loss of vegetation in turn causing a lack of rainfall.
Conservation Measures
- Non-Governmental Organizations: NGOs such as the Rainforest Trust and Fundacion Natutama play huge roles in protecting the rainforest.
- The Rainforest Trust aims to declare endangered parts of the rainforest as legally-recognized protected areas by either purchasing and maintaining the land themselves, making it a national park, or giving the local indigenous population the rights to and legal ownership of said land. This has been incredibly effective, as 99% of the rainforest that was once under endangerment continues to remain protected even after the Rainforest Trust ceased to completely protect them.
- Fundacion Natutama aims to educate the local population, particularly the younger generation, about how to sustainably manage and live alongside the rainforest. They also regularly monitor the populations of rainforest flora and fauna to identify any threats affecting them.
- Sustainable Forestry: This includes practices such as afforestation and selective logging. With the former, logging companies are made to replant whatever trees they cut down, while with the latter, they are only allowed to cut down a small portion of trees, to allow the forest to naturally replenish itself. Selective logging means logging companies harvest less timber, but is cheaper in the long run, as they don’t have to spend money replanting trees.
- Law Enforcement: Several of the logging and mining operations that threaten the Amazon rainforest are illegal. Hence, introducing stricter measures against such crimes are necessary to protect the Amazon rainforest.
Education
Educating the general public about the biomes they live in and how their actions affect them cultivates strong support for sustainable measures, and further incentivizes organizations to adopt more sustainable measures.
International Agreements
This is most commonly observed through debt-for-nature swaps, such as the one signed between the U.S. and Brazil in 2010. Around $21 million of Brazil’s debt to the U.S. was forgiven, with the money instead to be used to protect parts of the Amazon rainforest.
Technology
Monitoring through satellites: Satellite imaging and drones have become essential to law enforcement regarding illegal mining and logging operations. Satellite imagery allows experts to observe changes in forest cover in certain areas, hinting at the construction of an unpermitted road or mine. This allows the government to apprehend those involved and prevent the event before it occurs, rather than trying to repair the damage.
For this very purpose, Brazil developed the satellite Amazonia-1.
Temperate Forests
These forests are found, as the name suggests, in the temperate zone between the Arctic and Antarctic circles and the Tropics. They include rainforests, deciduous forests, conifer forests, and mixed forests.
Great Smoky Mountains
The Great Smoky Mountains, or the Smokies, are a mountain range along the Tennessee - North Carolina border in the U.S. The mountains are home to the Appalachian temperate rainforest, which houses both coniferous trees at higher elevations and deciduous cove forests at lower ones.
- Invasive species: The invasive hemlock wooly adelgid, an insect, is notorious for sucking the sap of and destroying hemlock trees, while balsam wooly adelgids attack fir trees.
- Air pollution: Pollution from coal plants nearby contaminated the air, resulting in acid rain which killed much of the red spruce and oak population.
Aquatic Biomes
Oceans: Oceans contain saltwater, and are home to a diverse array of flora and fauna. They contain coral reef ecosystems, estuaries, bays, and other water bodies.
- Environmental:
- Carbon sink: The ocean is another massive carbon sink, with the phytoplankton in the water using carbon dioxide to photosynthesize, releasing oxygen instead.
- Habitat: Thousands of plant and animal species call the ocean home, with the ocean biome itself housing coral reefs, which themselves are habitats of their own.
- Erosion and deposition: Wave activity near the shoreline contributes to the creation of new landforms, such as sea stacks, beaches, wave-cut platforms, headlands, bays, etc.
- Global temperatures: The phenomenon of land breeze and sea breeze impacts the temperatures of coastal areas, and ocean currents affect the temperature of certain winds, which in turn affect the temperature of other locations as a whole.
- Sociocultural:
- Importance to indigenous peoples: Seafaring cultures such as the Maori people of New Zealand view the ocean as having an important place in their culture.
Economical
- Food: The ocean supplies us with seafood, like fish and mollusks, as well as plants like seaweed, which are a staple of many cultures.
- Transport: Ships are used to transport large amounts of goods internationally.
- Tourism: Oceans and beaches are often huge tourist destinations, particularly for smaller island nations whose economies thrive on tourism.
- Leisure: Many people enjoy activities like swimming, surfing, jet skiing, etc.
Cabo Pulmo
Cabo Pulmo National Park in Mexico is home to the only coral reef ecosystem in the Gulf of California.
- Overfishing: Historically, Cabo Pulmo has been a natural habitat for large numbers of fish, including giant sharks and groupers, which made it a popular spot for fishing. However, by the 1980’s, the effects of overfishing began to take their toll on the reef.
- Concerned by the sudden drop in the fish population, locals petitioned authorities to convert the entire area into a no-fishing area that was simultaneously a national park in 1995. By 2005, in the span of just 10 years, the overall biomass of the reef had increased by 465%, and several fish species began to return to the area for breeding and spawning, increasing the biodiversity of the area.
Conservation Measures
- No-take zones/Marine protected areas (MPAs): The conversion of the entirety of the Cabo Pulmo area into a no-fishing zone in 1985 allowed the biodiversity of the area to recover and flourish in the span of just 10 years.
Technology
- Patrolling and use of radar: The organization Global Conservation promised to install $2 million’s worth of radar equipment to patrol ocean waters in Marine Protected Areas (MPAs) to detect the presence of poachers, using drones, long-range cameras, and radar.
Estuaries
An estuary is an area at the mouth of the river where it meets the sea that is partially enclosed by a sand spit. Estuaries contain brackish water (water that is partially saltwater and partially freshwater).
- Environmental:
- Habitat: The brackish water found in estuaries supports a variety of unique animal and plant species specifically adapted to the estuary ecosystem.
- Water filtration: The vegetation in estuaries, such as seagrass and mangroves, filters out pollutants in water from upstream, particularly if the water contains surface runoff from urban areas.
- Preventing erosion: The vegetation present in estuaries prevents the soil from being eroded by the river or waves.
Sociocultural
Indigenous peoples: Estuaries are important to Native American culture.
Economical
- Leisure: People enjoy activities such as boating, jet skiing, fishing, swimming, etc.
- Fishing: Estuaries are breeding grounds and nurseries for fish, mangroves in particular, as the vegetation underwater as well as slow water provides places for fish to hide and lay their eggs. Oysters, too, grow on the roots of mangroves.
- Tourism: Several estuaries are well-known, such as Tampa Bay and Chesapeake Bay, with hundreds of people coming to visit them, contributing to the economy.
Conservation Measures
- Oyster Restoration: The Tampa Bay Watch organization launched the Community Oyster Reef Enhancement program. They utilize artificial structures such as oyster shell bags and vertical reefs to promote the growth of oyster reefs in the bay.
- Habitat Restoration: Replanting vegetation such as mangroves helps stabilize the banks of estuaries and prevents soil erosion and sedimentation, while also providing more room for fish nurseries.
Technology
Permeable Pavement: Consists of either porous material, allowing for runoff to flow through, or nonporous material with gaps. Allows surface runoff to enter underground in place of directly entering water bodies, reducing chemical contamination and nutrient pollution.
Tampa Bay

A shallow estuary on the coast of Florida which connects to the Gulf of Mexico. Tampa Bay is an example of a drowned river valley estuary– an estuary formed when sea levels rise and flood existing river valleys.
The shallow waters allow the growth of seagrass beds and mangroves, which serve as nurseries for fish. Crabs and other marine animals also eat decaying grasses. Finally, the grasses also stabilize the sediment at the bottom of the bay, preventing silt and sand from clouding the water. Mangroves serve as both nurseries for fish, places for oysters to colonize and attach to, and habitats for birds.
Tampa Bay is affected by a variety of human activities. Primarily, a few of the tributaries which supply freshwater to the bay have been blocked off or redirected into reservoirs, which reduce the amount of freshwater entering the bay. Additionally, urbanization has prevented rainwater from seeping underground and replenishing aquifers, instead entering the bay as runoff. Though in newer cities in the area this runoff is treated, older cities lack proper treatment facilities, leading to harmful chemicals entering the water via runoff.
Chesapeake Bay
The largest estuary in the U.S.A., and is partially separated from the Atlantic Ocean by the Delmarva Peninsula.
Riparian forests line the bay. These are forests that are adjacent to the water body, acting as a buffer between surface and underground water runoff and the bay. The trees stabilize the banks of the estuary and filter water draining into the bay. They also act as carbon sinks.
The tree roots penetrate the soil, allowing surface runoff to enter and replenish groundwater aquifers. Additionally, fallen matter from trees such as leaves and fruit accumulate in the areas near the banks, providing nutrition for certain animals.
The bay also has underwater seagrass that serves the same purpose as the grass in Tampa Bay.
Chesapeake Bay is impacted, too, by human activities: namely untreated surface runoff and nutrient pollution.
Invasive Species
Aquarium owners often dump untreated water into lakes and rivers that empty out into the bay. The water contains seeds of invasive, non-local plants such as Brazilian waterweed, which flourish in the brackish water of the bay, endangering local vegetation.
Dead Zones
The bay was found to contain “dead zones”, or areas where the amount of dissolved oxygen in the water wasn’t enough to sustain life. This led to the death of multiple species of worms, which are a primary source of food for many of the animals that live in the bay. This is often caused by eutrophication, which occurs due to nutrient pollution, or the excess presence of nutrients in the water.
These nutrients enter the bay through surface runoff, mainly through farms. Cow manure contains several nutrients that algae require, which enter the river and cause nutrient pollution.
Oyster Overharvesting
Oysters in the bay are responsible for filtering out excess nutrients from the water. In the past, the oyster population could filter the entire bay in 3.3 days. However, the over-harvesting of oysters for pearls, as well as the illegal harvesting of oysters by unauthorized people, has led to a severe decline in the oyster population, leading to an increased amount of nutrient pollution.
Reefs
Coral reefs are diverse underwater ecosystems mainly formed around reef-building corals. These corals start out as polyps, before forming a colony of polyps, to create a coral reef.
Coral reefs are typically found near the equator in shallow areas, but deep-water reefs also exist. They require tropical temperatures to grow.
They serve as nurseries for fish and a variety of marine animals, and are often a source of tourism for a country.
They are under threat from a variety of factors. Polluted water harms the coral polyps, and the animals that live in them. Careless motorboat drivers and divers can harm the coral by touching it, or having it crushed in the propellers. Water runoff from the surface that hasn’t been properly treated facilitates the entry of pollutants into the ocean, killing the coral reefs.
Climate Change
- CO2 emissions: Carbon dioxide in the atmosphere diffuses into the water, increasing its pH levels and affecting the growth of the coral.
- Global warming: Increased water temperature causes “coral bleaching”. Coral polyps contain microorganisms called zooxanthellae, which photosynthesize and give corals their pigments. As the temperature increases, they synthesize chemicals which are harmful to the corals, leading the corals to expel them. This causes the coral to turn white, and though it doesn’t kill the coral, it upsets the natural balance of the ecosystem and makes them more vulnerable to infection and death.
- Rising sea levels: Increased sea levels leads to increased sedimentation (the accumulation of sediment in the water). This sediment can settle on corals and smother them. Additionally, corals require clear water with plenty of light to photosynthesize. The sediment clouds over the water, affecting the rate at which the reef can photosynthesize.
- Ocean currents: The change in the surface temperature of the water affects the flow of ocean currents, and hence the distribution of temperature in areas where coral reefs live, affecting the growth.
Coral Reefs
Environmental
- Habitat: Corals are habitats for a variety of fish like clownfish, and nurseries for them, too. They also house other marine organisms such as sponges.
- Water filtration: Sponges present in coral reefs are filter feeders, meaning that in the process of sustaining themselves they remove particulate matter from seawater.
- Wave breakers: Coral reefs act as breakwaters, and are capable of absorbing up to 97% of wave energy, reducing erosion in coastal areas.
Sociocultural
- Cultural customs: Coral reefs are an integral part of Hawaiian culture.
Economical
- Tourism: Coral reefs contribute greatly to tourism, with thousands of people traveling to coastal nations to view the reefs.
Conservation Measures
- Zoning: Dividing the area surrounding the reef into different zones. Some are for general use, for both tourists and experts alike, while others are completely off-limits to prevent damaging the corals. This allows people to enjoy parts of the coral reef which are thriving, while giving more vulnerable sections time to recover.
- Reducing Carbon Emissions: Several threats to corals, such as rising sea levels and increasing ocean temperatures, can be attributed to excess carbon emissions. Cutting down on emissions reduces these threats.
Technology
- 3D Printing: Researchers are 3D-printing artificial coral reefs that mimic the structure and appearance of real coral, and placing them in the ocean in the hopes that new coral polyps will attach onto these structures, building natural reefs on top of them. These artificial reefs also provide shelter and nurseries for marine organisms.
- Large-area Imaging: Taking several overlapping pictures of reef areas and digitally combining them to create a realistic 3D model. This allows scientists to track changes in growth and development over time.
Trends on Maps
- Coral Reefs: Typically found around the equator, usually off the coast of continents or islands in shallow waters.
- Deserts: Usually located near the western side of continents due to trade winds and ocean currents. Some deserts, like the Atacama, are rain-shadow deserts, located on the leeward side of mountain ranges.
Carbon Sink
Carbon sequestration is the long-term storage of carbon in a carbon sink. A carbon sink is an area that removes and stores carbon dioxide from the atmosphere.
Examples include:
- Forests: Trees use carbon dioxide in photosynthesis and release oxygen, making forests, particularly rainforests, excellent carbon sinks.
- Oceans: Phytoplankton consume carbon, making oceans efficient carbon sinks.
- Wetlands: Vegetation traps carbon through photosynthesis, while waterlogged soil slows decomposition, preventing the release of carbon dioxide back into the atmosphere.
Nitrogen Cycle
The nitrogen cycle is the process through which nitrogen is converted into a variety of chemical forms while passing through multiple ecosystems.
Process:
- Atmospheric nitrogen exists in triple covalent bonds, which plants cannot easily break.
- Nitrogen-fixing bacteria in soil, water, or roots of certain legumes convert nitrogen into ammonia using nitrogenase.
- Nitrifying bacteria convert ammonia into nitrates and nitrites, which plants can use.
- Plants are consumed by animals, which are consumed by predators. When animals die, denitrifying bacteria convert nitrates and nitrites back into atmospheric nitrogen, completing the cycle.
Eutrophication
Eutrophication is the excessive increase in nutrients in water bodies, leading to increased growth of simple plant life such as algae. Algae require large amounts of phosphates and nitrates to thrive. When the algae dies, it is decomposed by bacteria, which consume large amounts of oxygen to break down the algae. This depletes oxygen for other organisms in the water body, causing stress or death to aquatic life.
Causes
- Soil erosion: Phosphates attach to soil particles and enter water bodies during erosion.
- Pesticides and fertilizers: Fertilizers containing nitrogen, phosphorus, and potassium (NPK) contribute nutrients that promote algae growth.
- Industrial sewage and detergents: These can introduce excess nitrogen and phosphorus into water bodies.
Sustainable Alternatives
- Compost and organic matter: Decomposed bananas enrich soil with potassium.
- Powdered eggshells: Provide calcium (CaCO3) for plants.
- Animal bones: Source of phosphorus and calcium.
- Neem oil: A natural insecticide made by grinding neem leaves and mixing with coconut oil.
- Jaggery: Can be used to extract iron for plants through fermentation.
Note: Sustainable fertilizers may reduce yield, but they prevent environmental damage and long-term ecosystem depletion.
Examples of Algae
- Duckweed
- Water hyacinth
Steps of Eutrophication
- Rapid algae growth due to nutrient enrichment.
- Death of other plant life as light is blocked; water becomes anoxic (oxygen depleted).
- Bacterial decomposition of dead algae, further consuming oxygen.
- Death of animal life due to lack of oxygen.
Summary: Addition of excess nutrients into water bodies = Eutrophication.
Essay: Marking Scheme
| Criterion A | Marks | Descriptor | Notes |
|---|---|---|---|
| 0 | The student does not achieve a standard described by any of the descriptors given below. | ||
| 1–2 | This is given if the student demonstrates limited contextual and conceptual understanding in an outline, using limited examples and limited terminology. | Responses tend to be brief with little detail. An example is required but its absence does not prevent awarding marks. Terminology may be inaccurate or infrequent. | |
| 3–4 | The student shows adequate contextual and conceptual understanding in a description, using satisfactory examples and appropriate terminology. | Knowledge of the topic is evident. Examples are accurate but may lack detail. Terminology is generally used correctly. | |
| 5–6 | The student will demontrate substantial contextual and conceptual understanding in an explanation, using accurate examples and appropriate terminology. | This levell is given where clear explanations with reasons are provided. Examples support points well. Terminology is effective and mostly accurate. | |
| 7–8 | This is where student demonstrates detailed contextual and conceptual understanding in a thorough explanation, using accurate and effective examples and appropriate terminology. | There are detailed and well-supported responses throughout. Examples are fully developed and terminology is consistently accurate. |
| Criterion | Marks | Descriptor | Notes |
|---|---|---|---|
| Criterion C1 – Format | 0 | The student does not achieve a standard described by any of the descriptors given below. | |
| 1 | One of the following elements is included: introduction or conclusion. | The elements must appear as separate paragraphs. If this is not the case, 0 marks should be awarded. | |
| 2 | Both introduction and conclusion are included. | ||
| Criterion C2 – Communicating Information and Ideas | 0 | The student does not achieve a standard described by any of the descriptors given below. | |
| 1–2 | Language is rarely appropriate to a formal essay. Writing may be informal, unclear, basic, or too short to show understanding. | ||
| 3–4 | Language is occasionally appropriate. Writing shifts between informal and formal styles. Some engaging language features are used. | ||
| 5–6 | Language is consistently formal, clear, and appropriate. Engaging language features are used effectively throughout. | ||
| Criterion C3 – Organizational Structure | 0 | The student does not achieve a standard described by any of the descriptors given below. | |
| 1 | Ideas are rarely structured logically and transitions are rarely effective. | ||
| 2 | Ideas are sometimes structured logically with occasional effective transitions. | ||
| 3 | Ideas are mostly structured logically with frequent effective transitions. | ||
| 4 | Ideas are consistently structured logically with effective transitions throughout. | ||
| Criterion D | 0 | The student does not reach a standard described by any of the descriptors below. | |
| 1–2 | One perspective is provided with limited analysis and summary. The response may not fully answer the question. | ||
| 3–4 | Two perspectives are included with some development. Arguments are present but not fully developed. | ||
| 5–6 | Two perspectives are developed well and synthesized. A conclusion indicating extent is included. | ||
| 7–8 | Multiple perspectives are thoroughly developed and balanced. A convincing, well-synthesized conclusion is provided. |
How to Write a Geography Essay
Essay Structure
- Introduction – A brief summary that sets the context of the discussion and explains what the essay will explore.
- Claim – The main argument that supports the question or statement.
- Counter-claim – An opposing viewpoint that challenges the main argument and introduces alternative perspectives.
- Rebuttal – A response to the counter-claim that evaluates its weaknesses and offers a third perspective.
- Conclusion – A final summary that answers the question and reflects the introduction.
👉 The introduction and conclusion should also be around the same length.
Exemplar Essay
Task
To what extent does human development occur at the cost of the natural environment?
Success Criteria
- Consider at least two ways human development impacts natural environments and biomes
- Present different perspectives
- Use case studies from MYP Geography
- Apply appropriate geographical terminology
Exemplar Answer
Human Development vs. Nature: To What Extent Does Progress Cost the Planet?
Introduction
Human development refers to the process of improving people’s living standards through industrial growth, urbanization, and the use of natural resources. However, these activities often lead to the degradation of natural environments and biomes—large-scale ecosystems that support diverse forms of life. As nations develop, biomes such as tropical rainforests and grasslands are increasingly threatened by human activity. This essay explores the extent to which human development occurs at the cost of the natural environment by examining two case studies: the Amazon Rainforest in South America and the Sahel region in Africa. It will present a claim, a counter-claim, and a rebuttal to evaluate whether true balance between development and environmental protection is achievable.
Claim: Human Development Causes Severe Degradation of Natural Biomes
Human development often leads to the destruction of natural ecosystems as land and resources are exploited for economic growth. In the Amazon Rainforest, large-scale deforestation has taken place to make way for cattle ranching, soybean farming, and mining. This tropical biome, which covers over 5 million square kilometers, plays a crucial role in global climate regulation and biodiversity. Yet, thousands of square kilometers of rainforest are cleared each year in Brazil to meet rising global demands for food and raw materials. The result is habitat loss, declining biodiversity, and increased carbon emissions, which contribute to global warming.
Similarly, in the Sahel region—a semi-arid biome stretching across countries such as Mali, Niger, and Chad—overgrazing, deforestation for fuelwood, and unsustainable farming have led to desertification. These human activities weaken soil fertility and reduce vegetation cover, forcing communities into a cycle of environmental degradation and poverty. These examples show that development driven by short-term economic gains often comes at the expense of natural biomes.
Counter-claim: Sustainable Development Can Balance Human and Environmental Needs
Human development does not always have to result in environmental destruction. Sustainable development aims to meet current human needs while protecting ecosystems for future generations. In the Amazon Rainforest, sustainable forest management initiatives such as agroforestry, eco-tourism, and the protection of indigenous land rights have been introduced. These approaches allow economic activity while conserving forest ecosystems.
In the Sahel, the Great Green Wall Project seeks to restore degraded land by planting trees and improving water management. This large-scale initiative reduces desertification while providing employment and improving food security. These case studies demonstrate that when development is carefully managed, environmental protection and human progress can coexist.
Rebuttal: Sustainable Development Is Difficult to Maintain
Despite its potential, sustainable development faces significant challenges. In the Amazon, illegal logging, mining, and agricultural expansion continue due to global demand and weak enforcement. Economic pressures often override conservation efforts.
In the Sahel, projects like the Great Green Wall are limited by political instability, funding shortages, and climate variability. These obstacles reduce their effectiveness and slow progress. Therefore, although sustainable development offers solutions, human development still largely occurs at the expense of natural biomes.
Conclusion
Human development has improved living standards worldwide, but often at significant environmental cost. The Amazon Rainforest and the Sahel illustrate how deforestation, desertification, and biodiversity loss result from human activity. While sustainable initiatives provide hope, their impact remains limited by economic and political constraints. As a result, development continues to place pressure on natural biomes. A sustainable future will require stronger governance, global cooperation, and a commitment to balancing economic growth with environmental protection.
JUSTIFICATION – MARKING CRITERIA
Note: If the student only refers to ONE option in their response, the maximum that can be awarded is 3 marks.
| Marks | Descriptor | Notes / Examples |
|---|---|---|
| 0 | The student does not achieve a standard described by any of the descriptors below. | — |
| 1 | The student states their rationale. |
Example: Indigenous groups possess ancestral knowledge of the rainforest. (States a key factor only) |
| 2–3 | The student outlines their rationale. |
2 marks example: Indigenous groups have knowledge of the rainforest that can be used to protect fragile biodiversity. (Single sentence with brief explanation) 3 marks example: Indigenous groups like the Shipibo-Conibo have deep knowledge of the rainforest, which can guide sustainable farming practices such as agroforestry, protecting biodiversity. (Multiple supporting details) |
| 4–5 | The student justifies their rationale. |
4 marks example: Indigenous groups like the Shipibo-Conibo possess deep, ancestral knowledge of rainforest soil, flora, and biodiversity. Their involvement would guide sustainable farming practices, ensuring biodiversity protection. Strictly limiting cleared areas is only a short-term measure. (Rationale explained in some detail) 5 marks example: Indigenous knowledge supports sustainable farming and long-term biome health. This is more effective than top-down restrictions, which are difficult to enforce and may lead to illegal expansion. (Detailed reasoning with implicit comparison) |
| 6 | The student justifies in detail their rationale. |
6 marks example: Indigenous collaboration supports sustainable practices, long-term environmental protection, and community well-being in the Peruvian Amazon. (Comprehensive conclusion with depth) |
To write a good justification, the student must explain why the chosen option is the most reasonable in context, while also considering why the other options are limited.
Task
In the Peruvian Amazon, large areas of rainforest have been cleared to make way for palm oil plantations. This has affected indigenous communities such as the Shipibo-Conibo, who rely on the forest for their livelihoods, medicine, and cultural heritage.
The Government of Peru is examining satellite images to understand how palm oil expansion is impacting both the environment and local communities, and is exploring possible solutions to reduce these negative effects.
The Government of Peru is considering implementing one of the following actions:
- Strictly limit the area of rainforest that can be cleared for palm oil plantations.
- Require palm oil companies to collaborate with indigenous communities to promote sustainable and community-based production.
- Introduce financial incentives for reforestation and restoration of degraded land.
Task: Justify which one of the actions the Government of Peru should choose.
Exemplar Response
Indigenous groups like the Shipibo-Conibo possess deep, ancestral knowledge of the rainforest’s soil, flora, and biodiversity. Their involvement would guide the implementation of sustainable farming practices, such as agroforestry, ensuring that production methods protect fragile biodiversity and maintain the health of the Amazon biome.
This approach is more robust than a top-down restriction. Strictly limiting the cleared area is only a short-term, defensive measure that is difficult to enforce across the vast Amazon and may lead to illegal, unregulated expansion in remote areas.
Therefore, collaboration with indigenous communities is the most robust, reasoned, and holistic strategy to secure both long-term environmental protection and community well-being in the Peruvian Amazon.
ARTICLE WRITING
Recommended Format
- Introduction
- Major Challenges
- Sustainable Solutions
- Conclusion
Content Guidance
Introduction
- Introduce the global issue of human impact on natural systems.
- Highlight how extreme physical processes (floods, erosion, storms) are worsened by human interference.
- Emphasize the need for sustainable management and innovative solutions.
Major Challenges
- River Flooding (e.g. Thames River, London; Ganga, India): Urbanisation and deforestation reduce infiltration, increasing flood risk.
- Coastal Erosion (e.g. Sundarbans, India–Bangladesh): Mangrove destruction and coastal construction increase erosion and storm vulnerability.
- Climate Change (e.g. Himalayan Glaciers): Rising temperatures alter river flows and weather patterns.
Sustainable Solutions
- River Restoration (e.g. Thames River Restoration Project, UK): Reconnecting floodplains and creating wetlands.
- Coastal Protection (e.g. Mangrove replanting, Philippines): Soft engineering to restore natural barriers.
- Community & Policy Action (e.g. Namami Gange, India): Afforestation, waste management, and eco-friendly tourism.
Conclusion
- Reflect on global responsibility for protecting natural systems.
- Reinforce working with nature for long-term balance.
- Encourage youth involvement in sustainability.
MARKING SCHEME
Knowledge & Understanding
| Marks | Descriptor | Notes |
|---|---|---|
| 0 | The student does not achieve a standard described below. | |
| 1 | Limited knowledge and understanding. | Brief outline of impacts and solutions with limited examples and terminology. |
| 2–3 | Adequate knowledge and understanding. | Describes impacts and sustainable actions with appropriate examples and terminology. |
| 4–5 | Substantial knowledge and understanding. | Explains impacts and solutions clearly using accurate examples and terminology. |
| 6 | Detailed knowledge and understanding. | Thorough explanation with strong examples and precise terminology. |
Criterion C: Communicating
Criterion C1 – Format
| Marks | Descriptor |
|---|---|
| 0 | No required elements included. |
| 1 | One element included: introduction or conclusion. |
| 2 | Both introduction and conclusion included. |
Criterion C2 – Communicating Information & Ideas
| Marks | Descriptor | Notes |
|---|---|---|
| 1–2 | Rarely appropriate style. | Basic, informal language with little engagement. |
| 3–4 | Occasionally appropriate style. | Mix of formal and informal tone with some engagement. |
| 5–6 | Consistently appropriate style. | Formal, engaging language suited to a school magazine. |
Criterion C3 – Organizational Structure
| Marks | Descriptor | Notes |
|---|---|---|
| 1 | Rarely effective structure. | Poor flow and weak transitions. |
| 2 | Occasionally effective structure. | Some logical sequencing. |
| 3 | Mainly effective structure. | Clear progression with effective transitions. |
| 4 | Consistently effective structure. | Strong flow, cohesion, and clarity throughout. |
Example
Task
You have been invited to write an article for your school magazine's special edition on global challenges. This edition focuses on the impacts of human activities on natural systems and the importance of sustainable solutions. As part of your research, you have studied case studies and reports highlighting how humans can manage natural processes for environmental sustainability.
In your article, explain how people can take sustainable actions to manage natural systems affected by extreme physical processes, suggesting ways to maintain environmental balance.
Your article must include:
- An introduction
- A conclusion
- Examples from your MYP studies
Answer – Restoring Balance: Managing Natural Systems for a Sustainable Future
Introduction
In today’s world, the impact of human activity on Earth’s natural systems has become increasingly evident. From melting glaciers to devastating floods, extreme physical processes—both natural and human-induced—are reshaping the planet’s delicate environmental balance. While these processes, such as river flooding or coastal erosion, are part of the Earth’s natural cycle, human interference through deforestation, urbanisation, and pollution has intensified their effects. This article explores how people can take sustainable actions to manage natural systems impacted by such processes, drawing on examples to show how innovation and awareness can help restore environmental balance.
The Challenge: Human Impact on Natural Systems
Extreme physical processes often become disasters when humans disrupt natural systems. Urbanisation and deforestation along riverbanks reduce natural infiltration, increasing the risk of flooding. A prime example is the Thames River in London, where industrial growth and altered river channels once worsened flood risks. Similarly, in India, unplanned settlements along river plains, such as those near the Ganga, have made floods more frequent and destructive.
Coastal regions face similar pressures. Human activities such as sand mining, construction, and mangrove destruction have accelerated coastal erosion. In places like the Sundarbans, removing mangrove forests has reduced the natural protection against storm surges and rising sea levels, threatening both biodiversity and local livelihoods.
Human-induced climate change further amplifies these problems. Rising global temperatures intensify droughts, storms, and floods, disrupting ecosystems that maintain Earth’s balance. For example, melting glaciers in the Himalayas are altering river flows, endangering communities downstream.
Sustainable Management and Solutions
Sustainability lies at the heart of managing natural systems effectively. One approach is river restoration, which aims to return rivers to their natural state to reduce flood risk and improve ecosystems. The Thames River Restoration Project uses advanced technologies to reconnect floodplains, enhance water quality, and create wetlands that act as natural flood defences. This not only protects communities but also supports biodiversity.
In coastal areas, soft engineering strategies such as dune restoration and mangrove replanting offer long-term protection without harming the environment. Mangrove restoration projects in the Philippines have successfully reduced coastal flooding while supporting fishing communities, demonstrating sustainable action in practice.
Community awareness and policy intervention are equally crucial. Education programs on sustainable land use and government initiatives promoting afforestation, waste management, and renewable energy can collectively help restore the Earth’s systems. For example, India’s “Namami Gange” project focuses on cleaning the Ganga River while promoting eco-friendly tourism and waste treatment, balancing development with conservation.
Conclusion
The management of natural systems is one of humanity’s greatest responsibilities. Through sustainable planning, innovation, and community participation, people can mitigate the impacts of extreme physical processes and maintain environmental balance. Sustainable solutions—such as river restoration, coastal protection, and climate resilience— are most effective when humans work with nature rather than against it.
As young learners and future leaders, we must recognise our role in preserving the planet’s natural systems. Every action, from supporting green initiatives to spreading awareness, contributes to a more sustainable future. The choices made today will determine whether the natural world continues to sustain life or struggles under the weight of neglect.
Email Writing Format
- (optional): To
- (optional): From
- Subject:
- Salutations
- Arguments+Counter argruments (case studies)
- Farewells
Criteria B
Criteria B focuses on evaluating an action plan. This includes framing a research question, justifying the research question, and assessing the strengths and limitations of the investigative process.
Evaluating an Action Plan – Required Format
Strengths
Possible strengths may include:
- Clear and focused research questions
- Logical and reasonable structure of the action plan
- Use of a wide range of qualitative and quantitative data
- Use of valid and reliable information sources
- Integration of environmental, social, cultural, political, and technological aspects
Limitations
Possible limitations may include:
- Language barriers
- Limited or insufficient data
- Invalid or biased data sources
- Lack of ethical considerations
- Failure to consider environmental factors
- Unreasonable or unclear procedural structure
- Overly broad or unfocused research questions
Appraisal
The appraisal weighs up both strengths and limitations of the action plan and forms an overall judgement about the effectiveness of the student’s investigative process. This judgement may be stated explicitly or implied through evaluation.
Example
The government of the Netherlands is concerned about increasing coastal erosion and the long-term impacts of sea-level rise in the Zeeland region. Powerful waves, storm surges, and sediment loss are gradually eroding beaches and dunes, threatening farmland, housing, and local infrastructure. The Dutch authorities have appointed a research consultant to identify sustainable coastal management strategies that balance environmental protection with human safety and economic needs.
The consultant's action plan is shown below.
Possible Answers
Strengths
Clear Research Focus
The plan has a precise research question that directly targets sustainable coastal management in the Zeeland region. This clarity ensures that every stage of inquiry—from identifying erosion causes to suggesting solutions—remains aligned with the central aim and prevents the investigation from becoming unfocused.
Structured Stages of Work
Dividing the investigation into four stages (planning, research, data collection, and presentation) creates a clear and logical sequence. This structure supports effective time management and ensures that each stage builds meaningfully on the previous one.
Integration of Environmental and Social Aspects
The plan considers both physical processes and human impacts, including livelihoods, agriculture, and tourism. This integrated approach ensures recommendations are environmentally sound while remaining socially and economically realistic.
Use of Hard and Soft Engineering Examples
By comparing large-scale engineering structures such as the Delta Works with softer approaches like dune restoration and beach nourishment, the plan promotes analytical thinking and evaluation of long-term sustainability.
Primary and Secondary Data Collection
The inclusion of maps, photographs, interviews, and government reports encourages triangulation. Cross-checking information from multiple sources increases the reliability and validity of the findings.
Focus on Sustainable and Innovative Solutions
Strategies such as managed realignment and eco-tourism reflect modern environmental thinking. These approaches support natural processes while reducing ecological damage, aligning with climate adaptation goals.
Community Participation and Education
The plan recognises local communities as key stakeholders. Education and awareness initiatives increase long-term success by encouraging public support for sustainable coastal management.
Policy-Relevant Outcomes
By aiming to produce recommendations for government authorities, the plan demonstrates how geographical research can directly influence real-world policy and decision-making.
Limitations
Limited Access to Local Data
Non-local researchers may face challenges in collecting first-hand data due to distance, language barriers, and access restrictions. This may result in overreliance on secondary sources.
Time Constraints
An eight-week timeframe may be insufficient to study slow-changing coastal processes. Limited time could reduce the depth and accuracy of analysis.
Overreliance on Secondary Sources
Heavy dependence on reports and case studies may introduce bias or outdated information, particularly if sources reflect government perspectives more than community views.
Lack of Cost-Benefit Analysis
The plan does not assess the financial feasibility of proposed strategies. Without economic evaluation, recommendations may be impractical for implementation.
Broad Scope
Addressing environmental, social, and economic factors simultaneously may lead to surface-level analysis rather than in-depth exploration of key management strategies.
Limited Seasonal Consideration
Erosion and storm impacts vary seasonally. The absence of seasonal data risks overlooking important patterns that influence coastal management success.
Insufficient Risk Assessment
Potential risks, such as habitat loss or community displacement from managed realignment, are not clearly addressed. This may lead to overly optimistic conclusions.
Dependence on Government Cooperation
The success of recommendations depends on political will and funding availability. Conflicting priorities could limit implementation.
Appraisal
Overall, the Zeeland Coastal Management Action Plan is comprehensive, forward-looking, and well aligned with MYP Geography objectives. It demonstrates a strong understanding of sustainable interaction between humans and natural systems through integration of environmental science, community perspectives, and policy application. However, the investigation could be strengthened by narrowing its focus, incorporating financial and risk assessments, and improving access to local data. Despite these limitations, the plan remains a strong model for evaluating sustainable responses to coastal erosion.
Research Question & Justification
Note: It does not matter how many strengths and limitations you include. Quality is prioritised over quantity. Writing too many weak points may reduce marks. It is better to write one strong strength and one strong limitation in detail.
What Makes a Strong Research Question (RQ)
- Clear: The RQ should be specific and unambiguous.
- Focused: Targets one particular context, avoiding broad topics.
- Arguable: Allows debate and analysis supported by evidence.
- Uses “To what extent”: Encourages evaluation and judgement.
- Context-specific: Refers to a particular location or case study.
- Solution-oriented or evaluative: Assesses effectiveness or impact.
To frame an appropriate research question, the student must interpret the Statement of Inquiry (SOI) carefully. There are three main types of SOIs.
Types of SOIs and Research Question Formats
| SOI Type | Description | Research Question Format | Example |
|---|---|---|---|
| Factor → Issue (Cause & Influence) |
Examines how a specific factor causes or contributes to a geographical issue. | To what extent does [factor/variable] contribute to / affect [geographical issue] in [location]? | To what extent does illegal gold mining contribute to disease proliferation in the Yanomami tribe? |
| Issue → Impact (Consequences) |
Examines how a geographical issue impacts societies, environments, or economies. | To what extent does [geographical issue] impact [society/environment/economy] in [location]? | To what extent do droughts affect the rice-based economies of China? |
| Solutions → Effectiveness (Management & Sustainability) |
Investigates how effective a solution is in managing a geographical issue. | To what extent are [solutions/strategies] effective in addressing [geographical issue] in [location]? | To what extent is land demarcation effective in addressing declining ELF rates in the Awá tribe of the Brazilian Amazon? |
Justifying the Research Question
A strong justification should be written in three clear parts:
- Problem in Context: Explain the issue in its real-world setting and why it is significant.
- Solution: Describe the proposed or existing solution and its relevance.
- Reason for Investigation: Explain why the solution needs to be evaluated and who the findings could help.
Marking Scheme
| Marks | Use of Terminology | Knowledge & Understanding |
|---|---|---|
| 0 | The student does not reach a standard described by any of the descriptors. | The student does not reach a standard described by any of the descriptors. |
| 1–2 | Uses limited relevant terminology. | Demonstrates basic knowledge with minimal description or examples. |
| 3–4 | Uses some terminology accurately and appropriately. | Demonstrates adequate knowledge through satisfactory descriptions, explanations, and examples. |
| 5–6 | Uses a range of terminology accurately and appropriately. | Demonstrates substantial knowledge through accurate descriptions, explanations, and examples. |
| 7–8 | Consistently uses a wide range of terminology effectively. | Demonstrates excellent knowledge through thorough, accurate descriptions, explanations, and examples. |
Marking Rubrics
Criterion D: Thinking Critically
| Marks | i. Concepts, Issues, Models & Theories | ii. Synthesis of Information | iii. Source Analysis (Origin, Purpose, Value & Limitations) | iv. Perspectives & Implications |
|---|---|---|---|---|
| 0 | The student does not reach a standard described by any of the descriptors. | |||
| 1–2 | Analyses concepts, issues, models, visual representations and theories to a limited extent. | Summarizes information to a limited extent to make arguments. | Describes a limited number of sources in terms of origin and purpose and recognizes nominal value and limitations. | Identifies different perspectives with minimal implications. |
| 3–4 | Analyses concepts, issues, models, visual representations and theories. | Summarizes information to make arguments. | Analyses and/or evaluates sources in terms of origin and purpose, recognizing some value and limitations. | Recognizes different perspectives and suggests some of their implications. |
| 5–6 | Discusses concepts, issues, models, visual representations and theories. | Synthesizes information to make valid arguments. | Effectively analyses and evaluates a range of sources, usually recognizing value and limitations. | Interprets different perspectives and their implications. |
| 7–8 | Completes a detailed discussion of concepts, issues, models, visual representations and theories. | Synthesizes information to make valid, well-supported arguments. | Effectively analyses and evaluates a range of sources, consistently recognizing value and limitations. | Thoroughly interprets a range of perspectives and their implications. |
Criterion B: Investigating
| Marks | i. Research Question & Justification | ii. Action Plan | iii. Research Methods & Data Collection | iv. Evaluation of Investigation |
|---|---|---|---|---|
| 0 | The student does not reach a standard described by any of the descriptors. | |||
| 1–2 | Formulates a research question that is clear or focused and describes its relevance. | Formulates a limited action plan or does not follow a plan. | Collects and records limited information, not always consistent with the research question. | Makes a limited evaluation of the process and results. |
| 3–4 | Formulates a clear and focused research question and describes its relevance in detail. | Formulates and somewhat follows a partial action plan. | Uses research methods to collect mostly relevant information. | Evaluates some aspects of the process and results. |
| 5–6 | Formulates a clear and focused research question and explains its relevance. | Formulates and follows a substantial action plan. | Uses research methods to collect appropriate and relevant information. | Evaluates the process and results of the investigation. |
| 7–8 | Formulates a clear and focused research question and justifies its relevance. | Formulates and effectively follows a comprehensive action plan. | Uses research methods to collect appropriate, varied and relevant information. | Thoroughly evaluates the investigation process and results. |
Criterion C: Communicating
| Marks | i. Communication Style | ii. Structure & Format | iii. Referencing & Sources |
|---|---|---|---|
| 0 | The student does not reach a standard described by any of the descriptors. | ||
| 1–2 | Communicates ideas in a limited way using a style that is not appropriate. | Structures information in a limited way. | Documents sources in a limited way. |
| 3–4 | Communicates ideas satisfactorily using a somewhat appropriate style. | Structures information in a somewhat appropriate way. | Sometimes documents sources using a recognized convention. |
| 5–6 | Communicates ideas accurately using a mostly appropriate style. | Structures information in a mostly appropriate way. | Often documents sources using a recognized convention. |
| 7–8 | Communicates ideas effectively and accurately using a completely appropriate style. | Structures information in a completely appropriate way. | Consistently documents sources using a recognized convention. |
Past Papers
Paper 1
In this task (Question 1), you will use the concept of systems to explore natural systems. The global context is Scientific and Technical Innovation. You will be assessed using Criterion A (Knowing and Understanding).
Question 1.1
State two impacts of plastic pollution on coastal systems.
Question 1.2
Explain the differences between the two hydrographs in Source A, focusing on the lag times and flood scenarios in each case.
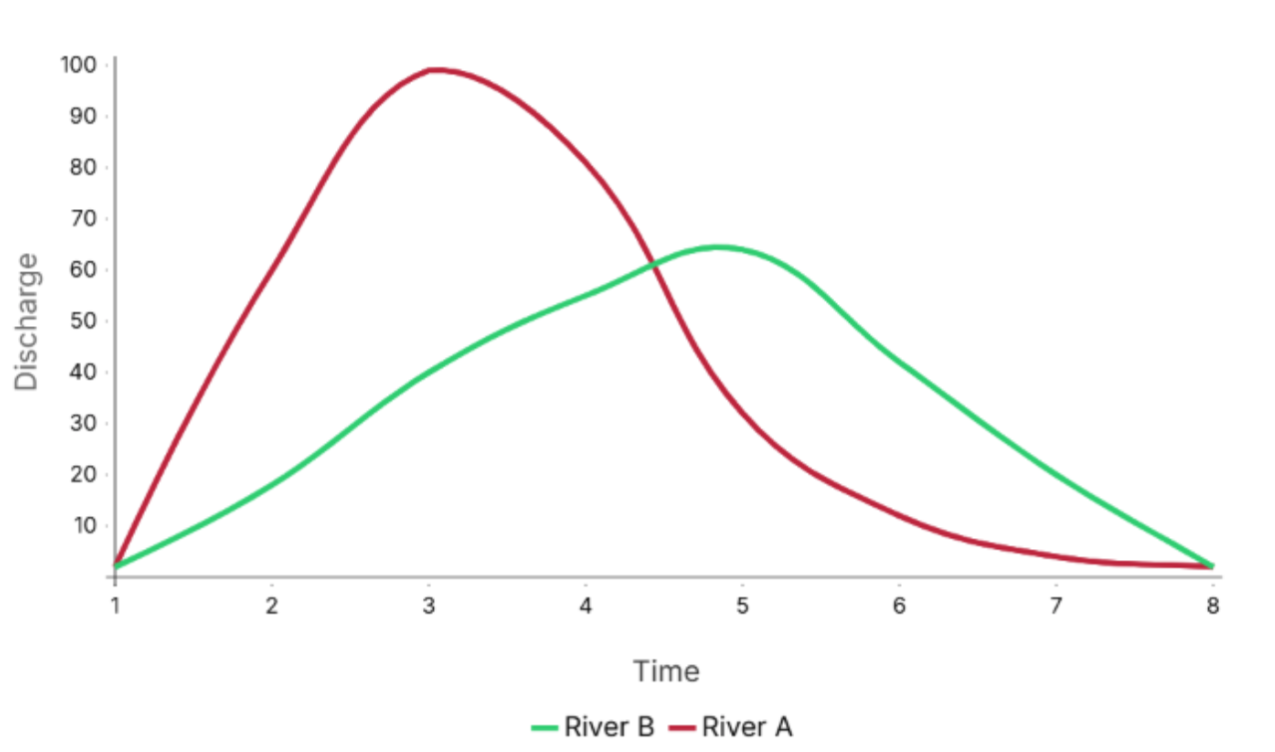
The red hydrograph shows a short lag time, a steep rising limb, and a rapid response to rainfall. This suggests impermeable surfaces, likely caused by urbanisation or hard rock petrology, leading to rapid runoff and a higher risk of flooding. The green hydrograph displays a longer lag time and gentler rising and falling limbs, indicating greater vegetation cover, permeable rock, and higher infiltration rates. As a result, River B is less prone to flooding.
Evaluating Sources (OPVL)
In this task (Question 2), you will evaluate sources related to managing river systems using the key concept of systems. You will be assessed using Criterion D (Thinking Critically).
Strengths vs Limitations of Sources
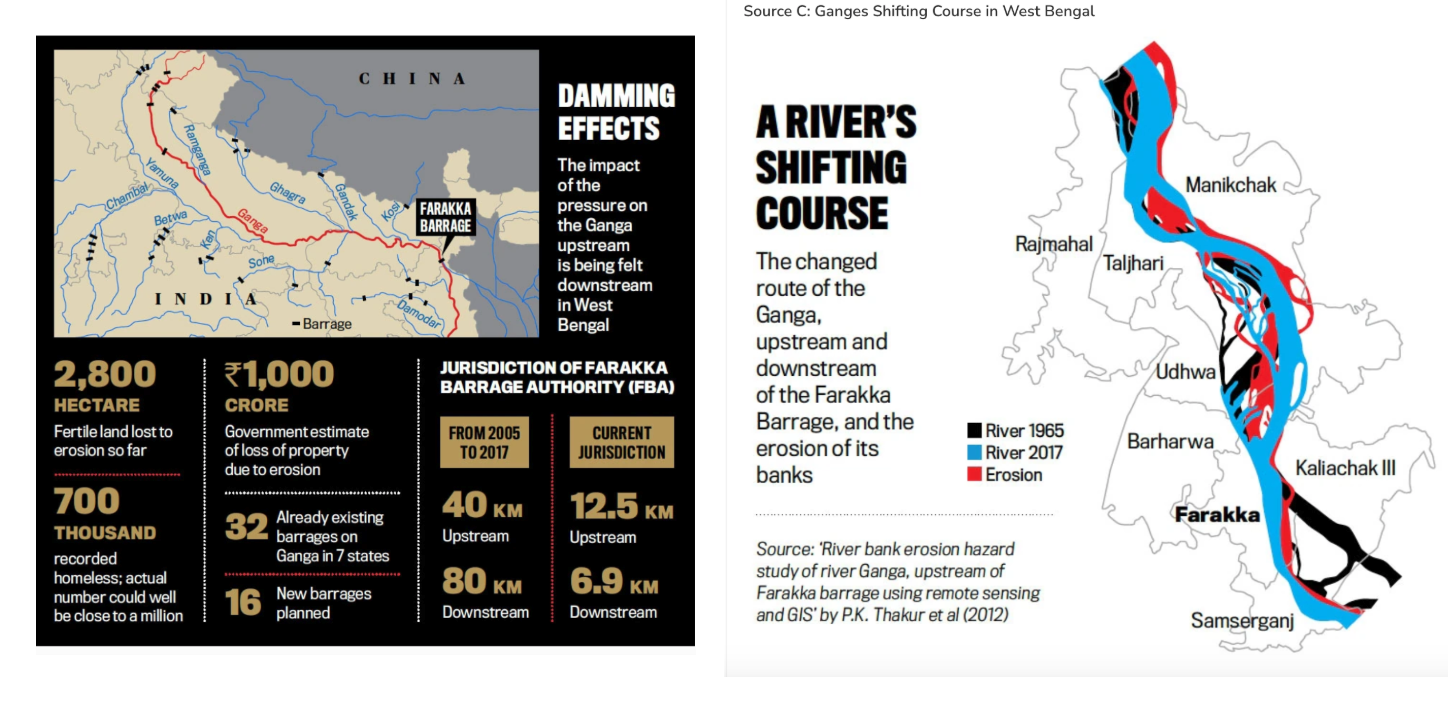
Source B is valuable because it presents quantified socio-economic data using a clear infographic format, making complex information accessible and easy to interpret. This supports informed decision-making when assessing sustainable alternatives to damming.
However, Source C is limited as it relies heavily on visual representation without sufficient quantitative data or temporal detail. This restricts its usefulness when evaluating long-term impacts and sustainable management strategies.
Coastal Management Analysis
In this task (Question 3), you will analyse sources related to coastal management using the key concept of systems. You will be assessed using Criterion D (Thinking Critically).
The coastline of Norfolk is changing due to marine erosion processes such as hydraulic action and abrasion. Wave undercutting leads to oversteepened cliffs, resulting in slumping and mass movement. Storm surges and rising sea levels accelerate these denudational processes.
Possible solutions include hard engineering methods such as sea walls and rock armour, as well as soft engineering strategies like beach nourishment, managed realignment, and vegetation planting. An integrated approach provides the most sustainable long-term management.
Extended Essay Question
In this task (Question 4), you will write an essay using the key concept of systems. You will be assessed using Criterion A (Knowing and Understanding) and Criterion D (Thinking Critically).
Essay Question:
To what extent are engineering strategies effective and sustainable within broader efforts to manage river and coastal environments?
- Consider at least two engineering strategies
- Include different perspectives
- Use examples from your MYP studies
- Use appropriate geographical terminology