Chemistry
common polyatomic ions
| name | formula | valency |
|---|---|---|
| sulfate | SO₄²⁻ | 2 |
| sulfite | SO₃²⁻ | 2 |
| nitrate | NO₃⁻ | 1 |
| nitrite | NO₂⁻ | 1 |
| hydrogen carbonate | HCO₃⁻ | 1 |
| hydroxide | OH⁻ | 1 |
| carbonate | CO₃²⁻ | 2 |
| ammonium | NH₄⁺ | 1 |
Simple ions are made up of only one type of atom or element.
Complex or polyatomic ions are made up of multiple atoms bonded together.
The ending -ide usually refers to nonmetals, such as chloride (Cl⁻), except in compounds like hydroxides (example: potassium hydroxide, KOH).
diatomic elements
All halogens exist as diatomic molecules.
transition metal compounds
Transition metals can form multiple ions with different charges. Roman numerals show the oxidation state of the metal.
Iron:
Fe₂O₃ — iron (iii) oxide
FeO — iron (ii) oxide
Manganese:
MnO₂ — manganese dioxide
Copper:
Cu₂SO₄ — copper (i) sulfate
CuSO₄ — copper (ii) sulfate
matter
Matter is any substance that has mass and occupies space.
states of matter
Matter mainly exists in three states: solid, liquid, and gas.
solids
fixed volume and fixed shape
particles tightly packed together
particles vibrate in place
strong intermolecular forces
liquids
fixed volume but no fixed shape
takes shape of container
particles loosely arranged
particles flow past each other
relatively weak intermolecular forces
gases
no fixed volume or shape
expand to fill container
particles move rapidly in random motion
very weak intermolecular forces
plasma
Plasma is the fourth state of matter. It is a gas whose particles are electrically charged.
Plasma forms when gas is heated to the point of ionization, where electrons are removed from atoms, creating positive ions and free electrons.
state conversion processes
solid → liquid : melting
liquid → gas : evaporation
gas → liquid : condensation
liquid → solid : freezing
gas → solid : deposition
solid → gas : sublimation
heating and cooling curves
A heating and cooling curve shows how temperature changes as heat energy is added or removed from a substance.
Flat regions represent phase changes. During these regions, temperature remains constant because energy is used to break intermolecular forces rather than increase temperature.
Melting point is the temperature where a solid becomes a liquid.
Boiling point is the temperature where a liquid becomes a gas.
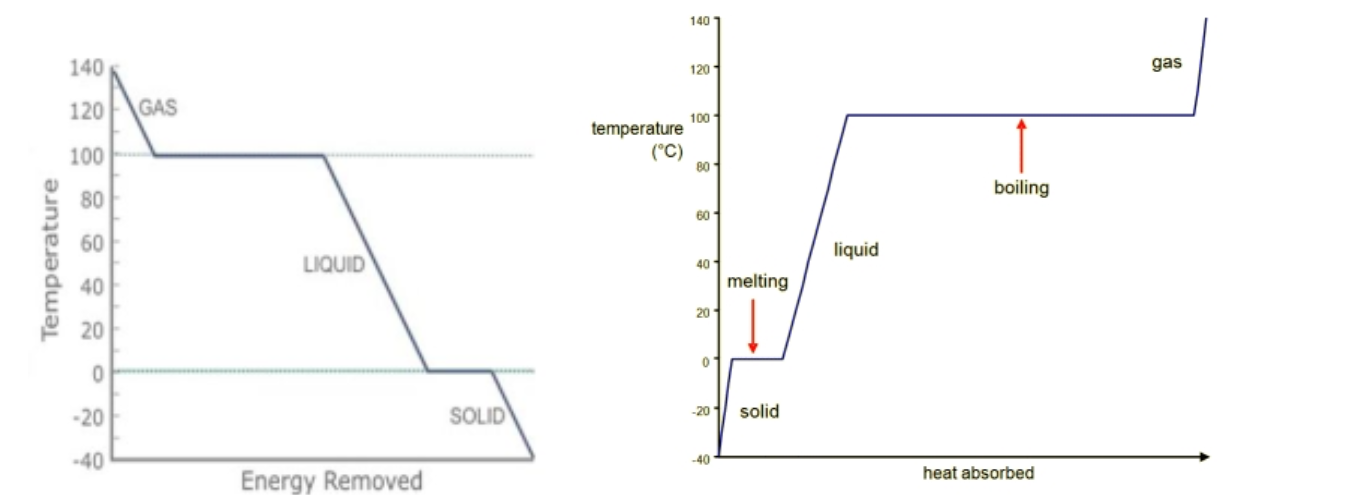
Heating and Cooling Curves
The plateaus on a heating curve show phase changes, where a substance is converting from one state to another. During these flat regions, the temperature does not increase even though heat energy is still being supplied. This is because the energy is not used to increase the kinetic energy of the particles. Instead, the energy is used to overcome intermolecular forces between particles, allowing them to move farther apart and change state.
Cooling curves are the reverse of heating curves. They show how temperature decreases as heat is removed and the substance transitions back through its states.
The melting point is the temperature at which a substance changes from solid to liquid, and the boiling point is the temperature at which it changes from liquid to gas. These temperatures appear as flat regions on the heating curve because energy is being used for the phase change rather than increasing temperature.
Factors Affecting the Length of Flat Regions
Presence of Impurities
Impurities dissolved in a substance affect its melting and boiling points. A pure liquid boils when its vapour pressure becomes equal to the atmospheric pressure exerted on it. Vapour pressure is the pressure exerted by particles escaping from the liquid into the gas phase.
When impurities are added, solvent particles occupy less of the surface area because impurity particles also take up space. This reduces the number of solvent particles that can escape into the gas phase at a given temperature. As a result, more heat energy must be supplied to increase the vapour pressure to the level required for boiling. Therefore, the presence of impurities increases the boiling point of a substance.
In solids, impurities disrupt the regular crystalline structure. This weakens the intermolecular forces holding the particles in place, which lowers the melting point of the solid.
Air Pressure
According to Le Chatelier’s principle, when pressure is increased in a system at equilibrium, the system shifts to reduce that pressure. When a substance melts or boils, particles move farther apart, which increases the pressure they exert.
If external air pressure increases, it becomes harder for particles to separate into liquid or gas states. Therefore, more energy (higher temperature) is required for melting or boiling to occur. This means that increasing air pressure raises both the melting point and boiling point, while decreasing air pressure lowers them.
Video Explanation
However, there are some exceptions to this rule. Certain substances have liquid and gas forms that occupy less volume than their solid form. In these cases, increasing air pressure actually decreases the melting point, because the system favors the state that occupies less volume.
The amount of heat input also affects phase changes. When more heat is supplied, particles gain energy faster, allowing them to overcome intermolecular forces more quickly and transition into the next state.
The mass of the substance also plays an important role. A greater mass requires more energy to change phase, which increases the time required for the entire substance to melt or boil.
Factors Affecting the Slope of Non-Flat Regions
The mass of the substance affects how quickly its temperature increases. A larger mass heats up more slowly, resulting in a gentler, shallower slope on the graph, while a smaller mass heats up faster and produces a steeper slope.
The specific heat capacity of a substance is the amount of heat required to raise the temperature of one unit mass of the substance by one degree Celsius. It reflects how resistant a substance is to temperature change. Substances with a high specific heat capacity require more energy to heat up and therefore have a shallower slope, while substances with a low specific heat capacity heat up quickly and have a steeper slope.
Diffusion
Diffusion is the net movement of particles from a region of higher concentration to a region of lower concentration. This occurs due to the random motion of particles and continues until the particles are evenly distributed.
The rate of diffusion is affected by several factors. Smaller particles diffuse faster than larger particles because they can move more easily. A greater concentration gradient increases the rate of diffusion because there is a larger difference between concentrations. A shorter diffusion distance increases the rate, while a longer distance slows it down.
Membrane permeability also affects diffusion. More permeable membranes allow particles to pass through more easily, increasing the rate of diffusion. Higher temperatures increase particle energy and motion, resulting in faster diffusion. A larger surface area allows more particles to diffuse simultaneously, increasing the overall rate.
In gases, molecular mass also affects diffusion. Heavier gas molecules move more slowly due to greater inertia, while lighter molecules diffuse more quickly.
Kinetic Theory of Gases
The kinetic theory of gases is a model used to explain the behavior and physical properties of gases at the molecular level. It describes gases as consisting of particles that are in constant, random motion.
These particles continuously collide with each other and with the walls of their container. These collisions are elastic, meaning that no total kinetic energy is lost during collisions.
Gas particles are extremely small, and the total volume they occupy is negligible compared to the volume of their container. There are also no significant attractive or repulsive forces between gas particles.
The average kinetic energy of gas particles is directly proportional to the absolute temperature of the gas. This means that gases at the same temperature have the same average kinetic energy, regardless of their identity.
When gas particles collide with the walls of their container, they exert force on the walls. This force, when divided by the surface area, produces pressure. This explains how gas pressure arises from molecular motion.
Compounds and Mixtures
A compound is a pure chemical substance made up of identical molecules that contain two or more different elements chemically bonded together. These elements are joined in fixed proportions and cannot be separated by physical means.
A mixture consists of two or more elements or compounds that are physically combined but not chemically bonded. Because of this, the components of a mixture can be separated using physical separation techniques.
Mixtures can be classified as either homogeneous or heterogeneous. Homogeneous mixtures have a uniform composition throughout. An important example of a homogeneous mixture is a solution, which consists of a solute and a solvent. The solute is the substance present in smaller amounts and is dissolved, while the solvent is present in larger amounts and dissolves the solute.
Heterogeneous mixtures do not have a uniform composition. Examples include suspensions and colloids.
Suspensions
Suspensions are mixtures in which particles are spread throughout a medium but are large enough to eventually settle at the bottom when left undisturbed. These particles can also be separated by filtration.
Colloids
Colloids are mixtures in which particles remain evenly distributed throughout the medium and do not settle over time. Colloids are able to scatter light, a phenomenon known as the Tyndall effect.
Types of Colloids
Sols: The dispersed phase is a solid and the dispersion medium is a liquid. Examples include ink and blood.
Gels: The dispersed phase is a liquid and the dispersion medium is a solid. An example is jelly.
Foams: The dispersed phase is a gas and the dispersion medium is a liquid. An example is soap foam.
Emulsions: The dispersed phase is a liquid and the dispersion medium is also a liquid, but the liquids are immiscible. An example is mayonnaise.
Aerosols: The dispersed phase is a liquid and the dispersion medium is a gas. Examples include mist and fog.
Solid Foams: The dispersed phase is a gas and the dispersion medium is a solid. An example is polystyrene.
Separation Techniques
Separation techniques are physical methods used to separate the components of a mixture without changing their chemical properties. These techniques rely on differences in physical properties such as density, particle size, and boiling point.
Centrifugation is a technique that uses centrifugal force to separate components of a mixture based on density. When the mixture is spun rapidly, denser particles move outward and settle at the bottom, while lighter particles remain above.
Sedimentation is the process of allowing a mixture of an insoluble solid and liquid to stand undisturbed. Over time, the heavier solid particles settle at the bottom due to gravity, while the lighter liquid remains above. This method only works when the solid does not dissolve in the liquid.
Decantation is used after sedimentation has occurred. It involves carefully pouring off the upper, less dense liquid layer, leaving the denser solid behind at the bottom of the container. This allows the two components to be separated.
Filtration is a separation method in which a mixture is passed through a filter. The solid particles that cannot pass through the filter remain behind and are called the residue, while the liquid that passes through is called the filtrate. This method is used to separate insoluble solids from liquids.
Simple distillation is used to separate liquids with very different boiling points or to separate a dissolved solid from a liquid. The liquid with the lower boiling point evaporates first, then cools and condenses back into liquid form in a separate container, leaving the higher boiling point substance behind.
Fractional distillation is used to separate two or more liquids that have similar boiling points. The apparatus is similar to simple distillation, but includes a fractionating column. The column is cooler at the top, allowing less volatile substances to condense and return to the mixture, while more volatile substances remain as vapour and move into the condenser where they cool and collect.
The glass beads inside the fractionating column increase surface area for condensation. This prevents multiple substances from evaporating at the same temperature and improves separation efficiency.
Paper chromatography is a separation technique that separates substances based on how far they travel with a solvent. It involves two phases: the mobile phase, which is the solvent (such as water or alcohol), and the stationary phase, which is the paper.
The solvent moves upward through the paper by capillary action, carrying the mixture placed on the baseline. Substances that are more soluble in the solvent travel further, while less soluble substances travel shorter distances.
The movement of substances can be measured using the retention factor (Rf), which is calculated using the formula:
Rf = distance travelled by substance ÷ distance travelled by solvent
Each substance has a unique Rf value, which can be used to identify it.
Separating funnel is used to separate two immiscible liquids that do not mix, such as oil and water. The mixture is poured into the funnel and allowed to settle. The liquids form separate layers based on density, with the denser liquid at the bottom.
When the tap is opened, the denser liquid flows out first, leaving the less dense liquid behind. This allows the two liquids to be separated cleanly.
Evaporation and crystallization is used to obtain a dissolved solid from a solution. The solution is heated so the solvent evaporates, leaving behind the dissolved solute. The crystallization point can be checked by placing drops of the solution on a cool glass plate. Once crystals begin to form, the remaining solution is allowed to cool completely. The crystals are then washed with distilled water and dried in an oven to obtain the pure solute.
Emulsions are colloids formed from two immiscible liquids, such as oil and water. These liquids normally do not mix, but can be combined using an emulsifier.
Emulsifiers are amphiphilic substances, meaning one part is hydrophilic (attracted to water), while the other part is attracted to the non-polar substance such as oil. This allows the two liquids to remain mixed. Common examples of emulsifiers include egg yolk and mustard.
History of Atomic Structure
Democritus first proposed that all matter was made of tiny indivisible particles called atoms, from the Greek word atomos, meaning indivisible. He believed atoms could not be broken down further.
John Dalton later expanded on this idea and proposed his atomic theory, which stated that:
• All matter is made up of atoms.
• All atoms of an element have identical mass and properties.
• Compounds are formed by combining atoms of different elements.
• Chemical reactions involve rearrangement of atoms.
• Atoms cannot be created, destroyed, or subdivided.
However, later discoveries showed limitations in Dalton’s theory. He did not account for isotopes, which are atoms of the same element with different numbers of neutrons, such as carbon-12 and carbon-14. He was also incorrect in stating that atoms cannot be subdivided, as atoms contain subatomic particles including protons, neutrons, and electrons.
J.J. Thomson conducted the cathode ray tube experiment and discovered the electron. He observed a stream of negatively charged particles moving from the cathode to the anode inside a vacuum tube. These particles were attracted to positive plates and repelled by negative plates, proving they carried negative charge.
He concluded that these particles:
• Were negatively charged
• Had extremely small mass
• Were part of atoms
• Were present in all elements
Thomson proposed the plum pudding model, in which electrons were embedded within a positively charged atom, similar to fruit embedded in a pudding.
However, this model had limitations. It did not explain how atoms remained stable, and failed to account for the presence of a nucleus.
Ernest Rutherford later conducted the gold foil experiment, which showed that atoms are mostly empty space. He discovered that positive charge and most of the mass of the atom were concentrated in a small, dense central nucleus.
Based on his findings, Rutherford proposed the nuclear model of the atom, where electrons orbit around a central positively charged nucleus, similar to planets orbiting the Sun.
Limitations of Rutherford’s model became clear after further scientific study. According to classical physics, charged particles moving in circular motion radiate energy. This means electrons orbiting the nucleus would continuously lose energy, eventually collapsing into the nucleus, which would make atoms unstable. However, atoms are stable in reality.
His model also did not explain the arrangement of electrons or how electrons were organized around the nucleus.
In the gold foil experiment, Rutherford fired positively charged alpha particles at a thin sheet of gold foil. Most particles passed straight through, but a small number were deflected at large angles, and some even bounced back. This showed that atoms are mostly empty space, with a small, dense, positively charged nucleus at the center, and electrons located around it.
Niels Bohr later improved Rutherford’s model by proposing that electrons move around the nucleus in fixed energy levels called orbitals. Each orbital has a specific energy, which prevents electrons from collapsing into the nucleus.
Electrons can move between energy levels by absorbing or emitting energy in the form of photons. When an electron moves from a higher energy level to a lower one, it releases energy as light with a specific wavelength. This explains the emission spectrum observed in hydrogen.
Limitations of Bohr’s model were later discovered as quantum mechanics developed.
• It does not follow the Heisenberg uncertainty principle, which states that the exact position and momentum of an electron cannot both be known.
• It cannot accurately predict the spectra of atoms with more than one electron.
• It assumes electron orbits are circular, whereas actual orbitals have complex shapes.
• It suggests orbitals exist independently, but orbitals only exist when electrons occupy them.
Periodic Table
The periodic table is a structured arrangement of all known elements into rows called periods and columns called groups. Elements are arranged in order of increasing atomic number, which represents the number of protons in the nucleus.
This arrangement allows elements with similar chemical properties to be grouped together, making it easier to predict their behavior and interactions.
Elements
An element is a pure substance made of only one type of atom and cannot be broken down into simpler substances by chemical means. Each element consists of atoms with the same number of protons.
There are currently 118 known elements, of which 94 occur naturally, while the rest are synthetic elements created in laboratories.
The periodic table organizes elements based on their atomic number and recurring chemical properties. Elements in the same group have similar properties because they have the same number of valence electrons.
Properties of Important Groups
Group 1: Alkali metals have one valence electron, making them highly reactive. This group includes lithium, sodium, potassium, rubidium, caesium, and francium.
Their reactivity, atomic radius, and metallic character increase down the group, while their melting and boiling points decrease. These metals react vigorously with water, forming metal hydroxides and hydrogen gas. They are soft, shiny, and highly reactive.
Group 2: Alkaline earth metals have two valence electrons. This group includes beryllium, magnesium, calcium, strontium, barium, and radium.
Their reactivity, atomic radius, and metallic character increase down the group. Their melting and boiling points generally decrease, although magnesium is an exception. They react with water to form metal hydroxides and hydrogen gas, but less vigorously than alkali metals.
Metalloids are elements that have properties of both metals and nonmetals. They are semiconductors and are important in electronics. Examples include silicon and arsenic.
Group 17: Halogens are highly reactive nonmetals with seven valence electrons. This group includes fluorine, chlorine, bromine, iodine, and astatine.
They readily react with metals to form salts. Their atomic radius increases down the group, while reactivity decreases. Their melting and boiling points increase down the group.
Group 18: Noble gases have full valence shells, usually with eight valence electrons, making them extremely stable and unreactive. This group includes helium, neon, argon, krypton, xenon, and radon.
Their atomic radius increases down the group, and their melting and boiling points also increase. Because their outer shells are complete, they rarely form chemical bonds.
The large central block of the periodic table contains the transition metals. These elements can have multiple oxidation states, which is why elements such as iron can form iron (II) oxide and iron (III) oxide.
The periodic table is also divided into four major blocks based on electron configuration, known as the s-block, p-block, d-block, and f-block.
The periodic table is divided into four main blocks based on electron configuration. These blocks help classify elements according to where their valence electrons are located.
The s-block is located on the left side of the periodic table and includes groups 1 and 2. These elements are reactive metals and include the alkali metals and alkaline earth metals.
The p-block is located on the right side of the periodic table and includes groups 13 to 18. This block contains a wide variety of elements, including metals, metalloids, and nonmetals. Many important elements such as carbon, oxygen, and the noble gases are found in this block.
The d-block is located in the center of the periodic table and includes groups 3 to 12. These are the transition metals, which are known for their strength, high melting points, and ability to form multiple oxidation states.
The f-block is located at the bottom of the periodic table and consists of the lanthanides and actinides. These elements are often radioactive or artificially produced, and many are used in nuclear energy and advanced technologies.
Periodic Trends
Elements in the same period have the same number of electron shells. As you move across a period from left to right, electrons are added to the same energy level.
Elements in the same group have the same number of valence electrons, which is why they have similar chemical properties and reactivity.
Atomic radius decreases across a period from left to right. This is because the number of protons in the nucleus increases, which increases the attractive force pulling electrons closer to the nucleus, resulting in a smaller atomic radius.
Atomic radius increases down a group because additional electron shells are added. These extra shells increase the distance between the nucleus and the outer electrons, resulting in a larger atomic radius.
Chemical reactivity decreases across a period. As the number of valence electrons increases, atoms hold onto their electrons more strongly and are less likely to lose them, making them less reactive.
Chemical reactivity increases down a group. This is because additional electron shells increase the distance between the nucleus and the valence electrons. The attractive force between the nucleus and outer electrons becomes weaker, making it easier for the atom to lose electrons and react.
Ionization energy is the amount of energy required to remove an electron from an atom. Each electron in an atom has its own ionization energy, but the first ionization energy is usually considered, as it represents how easily an atom can lose its outermost electron.
Ionization energy generally decreases down a group because outer electrons are farther from the nucleus and less strongly attracted. It generally increases across a period due to increasing nuclear charge, which pulls electrons closer and makes them harder to remove.
Electron affinity is the amount of energy released when an atom gains an electron. It reflects the tendency of an atom to attract electrons. Electron affinity generally increases across a period and decreases down a group.
Electronegativity is the ability of an atom to attract shared electrons in a chemical bond. It generally increases across a period due to increasing nuclear charge, and increases up a group because atoms are smaller and attract electrons more strongly.
History of the Periodic Table
One of the earliest attempts to organize elements was made by German chemist Johann Wolfgang Döbereiner, who proposed the idea of triads.
Döbereiner grouped elements into sets of three called triads, where the elements had similar chemical properties and were arranged in order of increasing atomic mass.
According to Döbereiner’s law of triads, the atomic mass of the middle element was approximately equal to the average of the atomic masses of the first and third elements.
This pattern showed an early relationship between atomic mass and chemical properties, helping lay the foundation for the modern periodic table.
One example of a triad is lithium, sodium, and potassium, which all belong to the same group and have similar chemical behavior.
Despite its importance, Döbereiner’s model had several limitations. He was only able to identify five triads, which meant most known elements could not be classified. Additionally, many newly discovered elements did not fit into triads, and some elements grouped together did not share consistent chemical properties.
Another important contribution was made by British chemist John Newlands, who arranged the known 62 elements in order of increasing atomic mass. He observed that every eighth element showed similar physical and chemical properties.
He called this pattern the Law of Octaves, comparing it to the musical scale where notes repeat every eighth note: sa, re, ga, ma, pa, dha, ni, sa.
This showed that properties of elements repeat periodically when arranged in order of increasing atomic mass, which was an important step toward the modern periodic table.
However, Newlands’ model also had several limitations. His law only worked for elements up to calcium, and many elements with completely different properties were grouped together. For example, reactive alkali metals were placed alongside highly reactive nonmetal halogens.
Additionally, newly discovered elements did not follow the Law of Octaves, and some elements were forced into the same position, showing that the system was not flexible enough.
A major breakthrough came from Russian chemist Dmitri Mendeleev, who is widely known as the Father of the Periodic Table.
Mendeleev proposed the Periodic Law, which stated that the properties of elements are periodic functions of their atomic mass. This means that when elements are arranged in order of increasing atomic mass, their physical and chemical properties repeat at regular intervals.
He arranged the 63 known elements into rows based on increasing atomic mass, and placed elements with similar chemical properties into vertical columns. These similarities were determined based on how elements reacted with oxygen and hydrogen.
One of the most important features of Mendeleev’s table was that he left empty spaces for elements that had not yet been discovered. He predicted the properties of these missing elements using patterns observed in surrounding elements.
A famous example is eka-aluminium, which Mendeleev predicted would exist and estimated its mass and properties. This element was later discovered and named gallium, and its measured properties closely matched his predictions.
However, Mendeleev’s table also had limitations. It did not include noble gases, as they had not yet been discovered due to their lack of reactivity.
Additionally, although he arranged elements according to atomic mass, some elements had to be placed out of order to preserve similar chemical properties.
He was also unable to determine the exact position of hydrogen, since hydrogen shows properties similar to both alkali metals and halogens.
In some cases, elements with dissimilar properties were grouped together, while elements with similar properties were separated. These inconsistencies were later resolved with the discovery of atomic number.
H.G.J. Moseley:
Henry Moseley, an English physicist, discovered that properties of elements varied not with atomic mass, but with atomic number.
By arranging elements in order of increasing atomic number rather than atomic mass, the limitations of Mendeleev’s table were resolved.
Moseley’s periodic table is the modern periodic table, and his Modern Periodic Law states that
“properties of elements are the periodic function of their atomic numbers.”
Isotopes & Radioactive Decay:
Isotopes are species of an element with the same number of protons and atomic number, but differing numbers of neutrons, and therefore varying atomic masses.
Isotopic abundance refers to the relative abundance of each isotope of an element in a naturally occurring sample, expressed as a percentage.
Example: Hydrogen has three isotopes:
- Protium (1 proton, 0 neutrons)
- Deuterium (1 proton, 1 neutron)
- Tritium (1 proton, 2 neutrons)
Isotopes can be stable or unstable.
Stable isotopes do not decay into other elements and are non-radioactive.
Certain combinations of protons and neutrons make an atom stable, similar to how a full electron shell stabilizes an atom.
Unstable isotopes exist because elements continuously decay into each other.
For example, carbon-14 is constantly renewed by cosmic rays interacting with Earth’s atmosphere.
Radioactive Decay:
Occurs when an isotope’s nucleus has excess energy. The extra energy is released as ionizing radiation, allowing the nucleus to achieve a more stable state.
- Alpha Decay: Atom loses 2 protons and 2 neutrons (helium nucleus) to form a more stable isotope.
- Beta Minus Decay: Atom has too many neutrons. An electron and an antineutrino are emitted, converting a neutron into a proton.
- Beta Plus Decay: Atom has too many protons. A positron and neutrino are emitted, converting a proton into a neutron.
- Gamma Decay: No particles emitted. Electromagnetic radiation is released, lowering the energy of an excited atom without changing its mass or atomic number.
Real-life Applications of Gamma Rays:
Gamma rays penetrate materials easily, making them useful in:
- Cancer treatment: killing carcinogenic cells
- Sterilization of equipment: breaking down bacterial DNA
Radiation and Cancer:
Ionizing radiation can disrupt chemical bonds in DNA, causing mutations that may lead to cancerous cells or tumors.
High radon exposure can cause lung cancer; flight crews and uranium miners are regularly exposed to radiation.
However, cancer development depends on multiple factors including genetics, lifestyle, and occupation.
Daily exposure to non-ionizing radiation like radio waves or microwaves is extremely unlikely to cause cancer.
Medical exposure from X-rays contributes minimally to cancer risk.
Sterilization:
Radiation therapy can also be used to destroy the genetic material in pathogens, allowing for sterilization of medical equipment.
Carbon-dating:
Carbon-dating is a technique used by archaeologists to determine the age of organic material like fossils or skeletons, accurate up to 50,000 years.
Carbon-14 enters the Earth's atmosphere via cosmic radiation from the Sun, then into plants and subsequently animals. After the animal dies, no more carbon-14 is absorbed, and the levels present at death begin to decrease due to radioactive decay. Older specimens have lower carbon-14 levels.
Treating Cancer:
Radiotherapy can destroy the genetic material of cancer cells, preventing them from multiplying. It is localized and can be administered in two ways:
- External beam (EBRT – External Beam Radiotherapy)
- Brachytherapy – a radiation-releasing device placed inside the body
Atomic Number, Mass Number, Molar Mass, Atomic Weight, Relative Atomic Mass, and Atomic Mass:
Mass number = protons + neutrons (nucleons), always a whole number.
Atomic number = number of protons in the nucleus.
Mass number may change between atoms of the same element due to isotopes, but atomic number remains constant.
Atomic mass = mass of a single atom, measured in amu (1 amu = 1.66 × 10⁻²⁴ g), same as 1/12 of a carbon-12 atom. Depends on protons and neutrons; varies due to isotopes.
Atomic weight = weighted average of isotopes (same as relative atomic mass), usually a decimal.
Molar mass = atomic weight in grams.
Notes:
Atomic mass and mass number are often similar for an element. Protons and neutrons contribute most of the mass; electrons are negligible. Atomic weight allows calculation of molar mass for chemical reactions.
This video explains it really well: Watch explanation video →
Molecular Mass
The mass of a molecule, calculated by adding the products of the atomic mass of each element and the number of atoms of said element.
Solved Example: Carbon Dioxide (CO2)
= (atomic mass of carbon) + (atomic mass of oxygen) × 2
= (12) + (16) × 2
= 12 + 32
= 44 g/mole
Naming Compounds
Ionic Compounds: The metal is always written before the nonmetal, which is given the suffix -ide. Example:
- MgCl2 = Magnesium Chloride
Binary Covalent Compounds: A prefix is added to the second element depending on the number of its atoms:
- NO2 = Nitrogen Dioxide
Compounds with Oxygen: If the nonmetal is bonded to oxygen as well as another element, the suffix -ate is used:
- CuSO4 = Copper (II) Sulfate
Anything ending in -ide indicates a monoatomic anion!
Common Chemical Compounds
- Methane: CH4
- Ammonia: NH3
- Sulfuric Acid: H2SO4
- Hydrochloric Acid: HCl
- Hydroxide: OH-
Oxidation States & Common Polyatomic Ions
- Ammonia: NH4, Valency: 1+
- Methane: CH4
- Nitrate: NO3, Valency: 1-
- Nitrite: NO2, Valency: 1-
- Sulfate: SO4, Valency: 2-
- Sulfite: SO3, Valency: 2-
- Hydroxide: OH, Valency: 1-
- Phosphate: PO4, Valency: 3-
- Zincate: ZnO2, Valency: 2-
- Aluminate: AlO2, Valency: 1-
Intermolecular and Intramolecular Forces
Intermolecular forces: Forces that act between molecules, i.e., electrostatic interactions between molecules.
Intramolecular forces (chemical bonds): Forces that bind atoms together to form a molecule or compound.
Types of Chemical Bonds
Ionic Bonds
Ionic bonding occurs between metals and nonmetals. Example:
- NaCl = Na (sodium) + Cl (chlorine)
Ionic bonds rely on electrostatic attraction between ions of opposite charges. When atoms with differing electronegativity meet, electrons are transferred from the less electronegative atom to the more electronegative atom:
- The atom losing an electron becomes a cation (+).
- The atom gaining an electron becomes an anion (-).
- Opposite charges attract, forming a strong ionic bond.
Properties of Ionic Compounds
- High Melting and Boiling Points: Strong electrostatic attraction between ions requires a lot of energy to break.
- Hard and Brittle: Layers of ions resist sliding; like-charge repulsion causes crystals to shatter.
- Poor Conductor of Electricity (solid): Ions are tightly packed and cannot move.
- Good Conductor of Electricity (liquid or dissolved): Ions are free to move in solution or when molten, generating current.
- Crystalline Structure: Ions are arranged in a regular lattice, forming crystals in solid form.
Covalent Bonds
Covalent bonding occurs between nonmetals (e.g., H2, O2). It involves the sharing of valence electrons between atoms. Covalent bonds can be polar or nonpolar.
Properties of Covalent Compounds
- Low Melting and Boiling Points: The intramolecular forces in covalent bonds are weaker than ionic bonds, requiring less energy to break.
- Nonpolar Covalent Compounds Cannot Dissolve in Polar Solvents (like water): Nonpolar molecules lack dipoles, so they do not interact with polar water molecules.
- Poor Conductors of Electricity: Covalent compounds lack free charged particles, so they cannot conduct electricity.
Polarity in Covalent Bonds
Polarity is the distribution of charge over atoms in a covalent bond. Polar covalent bonds occur between atoms with a large difference in electronegativity:
- The more electronegative atom attracts shared electrons more strongly → partial negative charge (δ-)
- The less electronegative atom gets a partial positive charge (δ+)
Nonpolar Covalent Bonds & Bond Types
Nonpolar covalent bonds: Form between atoms with similar electronegativity, ensuring that electrons spend a similar amount of time orbiting both nuclei.
Single, Double, and Triple Bonds
- Single bond: Atoms share a single pair of electrons.
- Double bond: Atoms share two pairs of electrons.
- Triple bond: Atoms share three pairs of electrons.
Intermolecular Forces
Dipole-Dipole Forces
Attraction between the partially positive region of one polar molecule and the partially negative region of another, along with repulsion between like charges.
London Dispersion Forces
A weak type of intermolecular bonding that occurs when electrons in adjacent neutral atoms occupy positions creating temporary dipoles, causing attraction between atoms.
Reference: Khan Academy – London dispersion forces
Hydrogen Bonds
Definition to be added (usually, a hydrogen atom covalently bonded to a highly electronegative atom interacts with a lone pair on another electronegative atom).
Metallic Bonds
Metallic bonding occurs between metal atoms. It is the strongest type of bond after ionic and covalent bonds.
In metals, atoms are tightly packed, and the outermost electrons are delocalized, moving freely among atoms. Metallic bonds rely on electrostatic attraction between the positively charged nuclei and the sea of delocalized electrons.
Properties of Metallic Bonds
- Electrical Conductivity: Delocalized electrons can move freely under an electric field, making metals excellent conductors.
- Malleability: Metal atoms can slide over each other without breaking the bond due to delocalized electrons, allowing metals to be hammered or stretched.
- High Melting Point: Strong attraction between nuclei and the electron sea requires a large amount of heat to melt metals.
- Lustrous: Delocalized electrons reflect light, giving metals a shiny appearance.
- Heat Conductivity: Heat energy is transferred efficiently via vibrations and delocalized electrons throughout the metal.
Macromolecular Bonding and Allotropes
Giant covalent structures: Large, three-dimensional structures made of atoms joined through covalent bonding.
Allotropy: The property of a chemical element to exist in two different physical forms in the same state of matter simultaneously. These forms are called allotropes, structural modifications of the same element where atoms are bonded differently.
Example: Diamond and Graphite are both allotropes of carbon.
Diamond
Diamond is a form of carbon characterized by its shiny, crystalline appearance.
Properties:
- High melting point: Strong covalent bonds between carbon atoms require a large amount of heat energy to break.
- Hardness and density: Each carbon atom is bonded to four others in a tetrahedral structure. Extremely hard and resistant to physical force.
- Poor conductor of electricity: No delocalized electrons or free ions to carry current.
Applications:

Jewellery: Diamonds disperse light, giving a shiny appearance, making them widely used in jewellery.
Tools: Hardest substance on earth, used in diamond-toothed saws for cutting extremely hard materials.
Graphite
Graphite is an allotrope of carbon that is silvery-grey. Individual sheets are called graphene.
Properties:
- High melting point: Covalent bonds between carbon atoms require substantial energy to break.
- Good conductor of electricity: Each carbon atom is bonded to three others, leaving one delocalized electron per bond.
- Soft: Hexagonal layers slide over each other easily due to weak interlayer attractions.
Applications:
- Pencils: Soft nature leaves dark marks on paper; inert and nonreactive.
- Lubricant: Layers of hexagonal rings slide over each other with minimal friction, making powdered graphite an effective dry lubricant.
Buckminsterfullerene and Silicon Dioxide (Silica)
Buckminsterfullerene (C60)
An allotrope of carbon that exists as a sphere made of hexagonal and pentagonal rings. Named after architect Buckminster Fuller because it resembles a football, or “bucky ball.”
Its properties lie between those of diamond and graphite.
Silicon Dioxide (Silica)
Silica is a covalent substance commonly found as sand and quartz. Each oxygen atom is bonded to two silicon atoms, and each silicon atom is bonded to four oxygen atoms, forming a tetrahedral structure similar to diamond.
Properties:
- Hard and dense: Strong covalent bonds make silica extremely hard and dense.
- High boiling point: Covalent bonds require substantial energy to break.
- Poor conductor of electricity: No delocalized electrons or free ions.
- Cannot dissolve in polar solvents: Nonpolar covalent bonds prevent dipole-dipole interactions with polar solvents like water.
Applications:
- Anticaking agent: Added to powdered substances to absorb moisture and prevent clumping.
- Stabilizer in beer: Silica gel helps suspended particles settle, reducing cloudiness.
Health Hazards:
- Inhaling powdered silica can increase the risk of lung cancer, lupus, rheumatoid arthritis, or bronchitis due to dust buildup in the lungs.
Reactivity Series of Metals
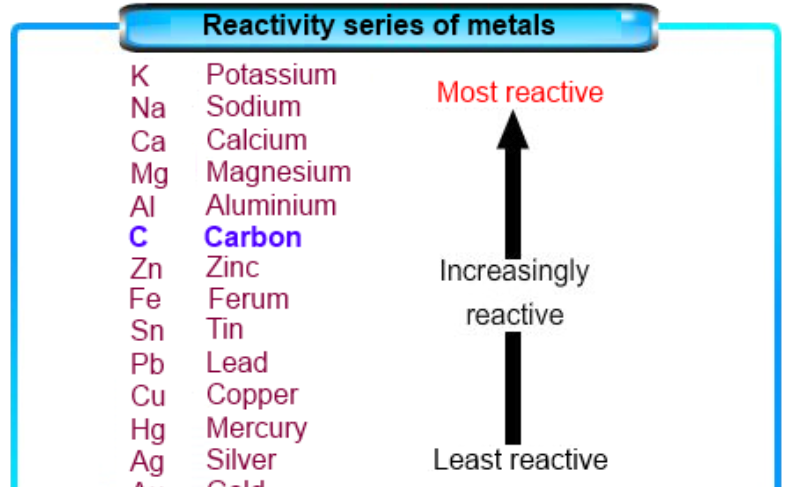
A common property of metals is their tendency to form positive ions (cations) when reacting with nonmetals. The reactivity of a metal is measured by:
- How readily it forms cations
- Time taken to react with air, water, or acids
- Violence/exothermic nature of the reaction
The reactivity of common metals is shown below, with hydrogen and carbon as references.
Reactions with Water
Elemental metals react with water to form metal hydroxides and hydrogen gas:
- Potassium: Reacts violently, hydrogen gas may ignite due to exothermic reaction.
- Copper: Does not react with water.
- Nonmetals normally do not react with water, except exceptions like chlorine gas, which forms hydrochloric acid and hypochlorous acid.
Tip: The reactivity series can be remembered with the acronym: "Please Stop Calling Me A Lazy Zebra, Instead Try Learning How Copper Saves Gold".
Trial by Fire – Flame Tests for Metals
Flame tests are used to determine the presence of certain metals or metal ions based on flame colour:
- Potassium: Lilac flame (invisible through cobalt blue glass)
- Calcium: Brick red flame (appears light green through blue glass)
- Lithium: Bright red flame (invisible through green glass)
- Copper (I): Bluish-green flame
- Copper (II): Green flame
- Copper (III): Blue-green flame
Thermal Decomposition and Reactivity of Metals
Thermal Decomposition of Carbonates
Carbonates are broken down into two or more different compounds using heat. For Group 2 carbonates, decomposition produces metal oxides and carbon dioxide gas:
Equation: XCO3 → XO + CO2 (X = any Group 2 metal)
Down the group, carbonates require more heat energy to break bonds and decompose, becoming more thermally stable. The greater the heat required, the more stable the carbonate.
Thermal Decomposition of Nitrates
Nitrates break down into multiple compounds when heated. For Group 2 nitrates, the products are metal oxides, nitrogen dioxide, and oxygen gas:
Equation: X(NO3)2 → XO + NO2 + ½ O2 (X = any Group 2 metal)
Nitrogen dioxide is visible as brown fumes and is toxic. Like carbonates, Group 2 nitrates become more thermally stable down the group.
Reactions with Oxygen
- Metals form a layer of metal oxide on their surface (e.g., iron forms rust = iron oxide).
- Nonmetals react with oxygen to form nonmetal oxides.
Reactions with Hydrochloric Acid
Metals react with acids containing halogens to form a salt and release hydrogen gas:
- Example: Sodium + HCl → Sodium Chloride (NaCl) + Hydrogen (H2)
- More reactive metals can displace less reactive metals in compounds, resulting in single or double displacement reactions.
Reduction, Oxidation, and Redox Reactions
Redox reactions: Reactions involving the transfer of electrons between elements or compounds.
Reduction
Reduction reactions involve:
- Gaining of electrons
- Loss of oxygen from a compound or molecule
- Gaining of hydrogen
The substance that undergoes reduction is called the oxidizing agent, as it causes the other substance to oxidize.
Oxidation
Oxidation reactions involve:
- Loss of electrons
- Gaining of oxygen by a compound or molecule
- Loss of hydrogen
The substance that undergoes oxidation is called the reducing agent, as it causes the other substance to reduce.
Example: 4Fe + 3O2 → 2Fe2O3
In this reaction, iron reacts with oxygen to produce iron (III) oxide. Iron gains oxygen and donates electrons to oxygen, resulting in oxidation. Rust formation is a physical observation of this process.
Oxidation States
The oxidation number of an element is the number of electrons an atom must gain or lose to form a bond if it were purely ionic:
- Alkali metals: +1
- Alkaline earth metals: +2
- Hydrogen: +1 with nonmetals, -1 with metals
Redox Reactions
Reduction and oxidation always occur simultaneously in a reaction, known as a reduction-oxidation (redox) reaction.
Net Ionic Equations
Definition: Net ionic equations show only the elements or ions directly involved in a chemical reaction, excluding spectator ions (ions that remain unchanged in aqueous solution).
Example:
Reaction: NaCl + AgNO3 → NaNO3 + AgCl
All compounds can be broken into ions except AgCl (solid).
Spectator ions: Na+ and NO3- do not participate in the reaction, so they are cancelled out.
Net Ionic Equation:
Ag+ (aq) + Cl- (aq) → AgCl (s)
Each ion in a redox reaction has a unique oxidation number (O.N.), which may differ from the valency. The oxidation number represents the total electrons an atom must gain or lose to form bonds in that reaction.
Rules for Oxidation Numbers
- In a neutral compound, oxidation numbers must sum to 0.
Example: CO2: C (+4) + O (-2) × 2 = 0 - In an ion, oxidation numbers sum to the charge on the ion.
Example: SO42-: 4(-2) + S = -2 → S = +6 - The oxidation number for free elements is 0 (e.g., N2, O2).
- Fluorine always has an oxidation number of -1.
- Group 1 elements: +1; Group 2 elements: +2.
- Hydrogen: +1 with nonmetals, -1 with metals.
- Oxygen: usually -2 (exceptions: compounds with fluorine or peroxides H2O2).
- Group 17 (7A) elements: usually -1, but can be positive when bonded with oxygen.
Extraction of Zinc from Zinc Blende
Zinc blende: The compound zinc sulphide (ZnS) from which pure zinc is extracted. Zinc has a low boiling point, so gaseous zinc can escape easily if heated excessively.
Steps in Extraction:
1. Concentration
Removes impurities to obtain a more concentrated ore. Achieved through froth-flotation:
- Crushed ZnS is mixed with water to form a slurry.
- A frothing agent (surfactant) is added. Hydrophilic parts attach to water; hydrophobic parts coat the ore particles.
- Pressurized air is introduced. Hydrophobic particles attach to bubbles and rise, forming a froth that is skimmed off.
2. Roasting
The froth is heated in a furnace with oxygen-rich steam to form zinc oxide (ZnO) and sulphur dioxide (SO2), which can be used to make sulfuric acid.
Equation: 2ZnS + 3O2 → 2ZnO + 2SO2
3. Reduction
ZnO is heated with coke (carbon) in a blast furnace at 1673 K to prevent zinc from boiling away:
Equation: ZnO + C → Zn + CO
4. Purification
Liquid zinc metal is purified via electrolytic refining.
Applications of Zinc
- Electronics: Zinc conducts electricity, used in electronic devices.
- Galvanization: Coating steel/iron with zinc to prevent rust. Often done via hot-dip galvanizing, where zinc acts as a sacrificial anode.
Extraction of Iron using Haematite
Haematite (Fe2O3) is a type of iron oxide commonly found in nature, from which pure iron is extracted through a series of processes involving a blast furnace.
In preparation, raw materials such as haematite ore, coke, and limestone are added into the blast furnace from the top, while hot air is introduced from below.
Zone 1
The high temperatures cause the coke, a type of coal-based fuel with a high carbon content, to burn, releasing carbon which reacts with the oxygen in the hot air, creating carbon dioxide.
C(s) + O2 (g) → CO2 (g)
Zone 2
The carbon dioxide reacts with additional carbon, producing carbon monoxide.
CO2 (g) + C(s) → 2CO
Zone 3
The carbon dioxide reacts with and reduces the iron oxide in the furnace, removing the oxygen and resulting in impure iron along with carbon dioxide.
Fe2O3 (s) + 3CO (g) → 2Fe (l) + 3CO2 (g)
The heat decomposes the limestone into calcium oxide and carbon dioxide.
CaCO3 (s) → CaO (s) + CO2 (g)
The latter escapes as a gas, while the former reacts with any silicon impurities in the ore to form calcium silicate, which settles on top of the molten iron as a slag which can be separated.
CaO (s) + SiO2 (s) → CaSiO3 (l)
Electrolysis
Electrolysis can be indirectly interpreted to mean “the splitting of ionic compounds using electricity.”
Electrolysis is the process of separating ionic compounds using electricity. For soluble ionic compounds, they are dissolved in water to create an aqueous solution, such as sodium chloride. For insoluble ionic compounds, they are melted down to create a molten solution, like lead bromide.
The solution is called the electrolyte.
Next, two conductors of electricity, typically made of metal or carbon (graphite) called electrodes are placed into the solution. The positively charged conductor is called the anode, and the negatively charged conductor is called the cathode.
Finally, the electrodes are connected by a wire to a power source such as a battery to facilitate the flow of an electric current.
When the current flows through the solution, the positively charged ions, or cations, will move towards the negatively charged cathode, accumulating near it. Meanwhile, the negatively charged anions will move toward the positively charged anode. The negatively charged anions give up their borrowed valence electrons and become neutral atoms once more. The electrons travel through the wire and are accepted by the cations near the cathode, which, too, become neutral atoms.
In the case of lead bromide, the lead cations become lead atoms and sink down, while the bromide ions become bromine atoms and escape the solution as a gas.
Electrolysis of Water
Sulfuric acid (H2SO4) is added to the water to make it acidic and increase the concentration of ions without changing the resulting products derived from the reaction. If another substance, for example, chlorine (Cl) were to be added, its ions (Cl-) would be oxidized instead of the hydroxide ions, and therefore the process of electrolysis would be interfered with.
H2O → H+ and OH-
Half-reaction occurring at cathode:
Half-reaction occurring at anode:
This is used to produce oxygen gas from water aboard the International Space Station, reducing the unnecessary load of carrying additional oxygen cylinders. Hydrogen produced from the reaction can also be used to make certain chemicals, as well as hydrogen fuel to power a hydrogen-oxygen fuel cell, and oxyhydrogen gas.
Electrolysis of Brine
Brine is a concentrated solution of aqueous sodium chloride (NaCl), formed by dissolving sodium chloride in water.
Here, brine serves as the electrolyte, and contains the ions H+, OH-, Cl-, and Na+. Carbon electrodes are used because the element is inert and will not react with any of the elements involved in the process.
The electrolysis of brine results in the final products of hydrogen gas (H2), chlorine gas (Cl2), and sodium hydroxide (NaOH), and is illustrated through the following equation:
2NaCl (aq) + 2H2O (l) → 2NaOH (aq) + Cl2 (g) + H2 (g)
Sodium chloride is dissolved in water to make brine. Being a soluble ionic compound, once dissolved, its ions dissociate, allowing the solution to conduct electricity.
Electrolysis – Detailed Ion Reactions
The Cl- ions, being negative, are attracted to the positive anode, and give up their extra electron in their valence shell and form covalent bonds with one another, producing chlorine gas (Cl2).
The H+ ions, being positive, are attracted to the negative cathode, and accept the extra electron from the chlorine gas, forming covalent bonds with one another and producing hydrogen gas (H2).
Both can be observed as the formation of bubbles around the electrodes.
HCl (hydrochloric acid) is not produced because H+ and Cl- ions are separated during the process.
Half-Equations:
- Oxidation: 2Cl- → Cl2 + 2e-
- Reduction: 2H+ + 2e- → H2
Sodium hydroxide is less electronegative than chlorine and hydrogen, hence, it is not electrolysed.
Environmental Impact (Criterion D)
The electrolysis of brine has a massive environmental impact, as it requires a large voltage of electricity, which can only be efficiently produced through the burning of fossil fuels, which releases excess greenhouse gases and pollutants into the environment, contributing to air pollution and global warming. Furthermore, mercury is used later down the process when refining the sodium hydroxide, which, if it leaches into the natural environment or builds up inside human beings, can have devastating consequences.
Electrolysis of Hydrochloric Acid (HCl)
In the following setup, the electrodes are both made of platinum, which is an inert metal and will not react with either the hydrogen or the chlorine.
- Half-reaction at anode: 2Cl → Cl2 (g) + 2e-
- Half-reaction at cathode: 2H+ + 2e- → H2 (g)
Thus, chlorine gas is produced at the anode, and hydrogen gas at the cathode as a result of this process. The setup for the electrolysis of hydrogen chloride is called a Hoffman Voltameter.
Electrolysis of Copper Sulfate (CuSO4)
To produce the electrolyte, copper sulfate is dissolved in water to make copper sulfate solution. The electrodes are either made of platinum or graphite, an allotrope of carbon, due to their inertness. As a result, the metal from the electrodes won’t be reduced instead of the electrolyte and be plated on the cathode as a result.
- Half-reaction at cathode: Cu2+ (aq) + 2e- → Cu (s)
The above forms a brownish copper deposit on the cathode.
The sulfate (SO42-) is too stable of a compound to be oxidized, hence, it remains in the electrolyte. Instead, the water is oxidized into H+ and OH- ions.
Alloying, Steelmaking, and Types of Steel
What is steel?
Steel is an alloy of iron, carbon, and other metals that is used because of its strength in comparison to pure iron. It is produced through the process of steelmaking, where impurities are removed from molten iron and desirable components are added in required ratios.
Separation of sulphur:
Powdered magnesium is added to molten steel, where it reacts with sulphur to form magnesium sulfide (Mg + S → MgS), which forms on the surface of the steel as a slag and is skimmed off.
Removal of carbon:
Oxygen gas is introduced to the molten iron mixture, where it reacts with carbon to form carbon monoxide (CO), and escapes and removes itself as a gas.
Carbon is removed to ensure no excess. Too much carbon in steel results in brittleness.
Removal of other impurities:
Phosphorus and silicon impurities react with the oxygen too to form oxides. These oxides react with quicklime (CaO) to form a slag on the surface of the molten iron which is removed.
 This is Aloy, not an alloy.
Types of Steel:
Carbon steel: 90% of steel produced is carbon steel, which can either be low, medium, or high carbon steel depending on the percentage of carbon in the alloy.
Low-carbon steel is used to make wire, medium-carbon for machinery like gears and shafts, and high-carbon for tools like knives.
Alloy steel: Alloy steels contain large amounts of other metals like manganese and copper, and are used to make things like generators and transformers.
Stainless Steel
This steel contains a minimum of 10% chromium, which makes it resistant to rusting (hence, no rust “stains”).
- Austenitic:
- Ferritic:
- Martensitic:
Electroplating and Electrorefining
Electroplating refers to the process of plating one metal onto another through the process of electrolysis. It can be used for a number of reasons, such as aesthetics (gold- or silver-plated jewellery), utility (astronaut visors used to be gold-plated to protect against the Sun’s radiation), or both (car wheel rims are plated for both reasons).
Process of Electroplating:
- Electrolyte: Solution containing metal to be plated onto the cathode.
- Anode: A strip or chunk of the pure metal to be plated onto the cathode to replenish the metal ions in the electrolyte.
- Cathode: The substance on top of which the metal is to be plated onto.
Using the example of copper plating:
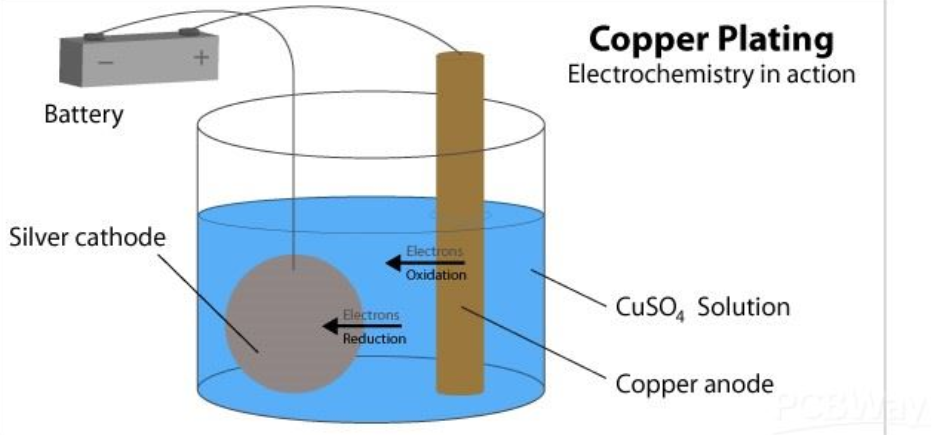
The anode in this diagram is a strip of pure copper, the electrolyte is copper sulfate solution, and the cathode is made of silver.
When the current is turned on, the anode becomes positively charged, and the cathode becomes negatively charged.
Electroplating – Detailed Ion Movements
The current passing through the electrolyte splits the copper sulfate molecule (CuSO4) into its constituent ions (Cu2+, SO42-).
The positive copper ions are attracted to the negative silver cathode and move towards it. They undergo reduction at the cathode and settle on top of it, forming a layer of copper on top.
Cu2+ + 2e- → Cu
The negative sulfate ions are attracted to the positive anode and move towards it. The copper ions in the copper anode undergo oxidation and give up their electrons, before bonding with the sulfate ions and dissolving in the solution, wearing down the copper anode.
Cu → Cu2+ + 2e-
As such, a layer of copper is gradually built up on top of the silver cathode while the copper anode is worn away to replenish the copper sulfate electrolyte.
Therefore, the copper ions indirectly move from the anode to the cathode through the electrolyte solution, while the electrons move from the anode to the cathode through the wire.
Criterion D
There are several environmental concerns associated with the electroplating of chrome, a.k.a chromium. The process produces a harmful air pollutant and human carcinogen, which must be treated accordingly before being released into the environment– a process that is often very costly.
Factors affecting electroplating (courtesy of Iya):
- Voltage level of current: An increase in the electric potential difference results in an increase in voltage, and by extent, the speed at which electrons travel through the wire increases and the speed at which electroplating occurs increases.
- Temperature and chemical concentration of the electrolyte: An increase in the temperature of the electrolyte or the concentration of the electrolyte results in an increase in the speed of electroplating. An increase in the temperature causes an increase in the average kinetic energy of the particles, causing them to collide with one another faster and increase the rate of reaction. Furthermore, an increase in the concentration means more ions are plated per second, increasing the rate of electroplating.
- Duration for which current is supplied: If the current is supplied for a longer period of time, then the plating on the cathode grows thicker as more ions are given the chance to be reduced and plated onto the metal.
- Distance between cathode and anode: The closer the electrodes are, the faster ions can travel and the metal gets plated faster.
Electrorefining
Electrorefining is the process of refining or purifying a metal, usually copper, through the process of electrolysis. Electrorefining is typically the final stage of a metal purification stage, occurring after the metal ore is refined, converted to a metal oxide, and reduced to an impure or crude form of the metal.
Process of Electrorefining:
- Electrolyte: Solution containing the metal to be extracted, typically a molten metal salt of that very same metal. The electrolyte is typically acidified by adding a few drops of sulfuric acid to facilitate smoother movement of ions.
- Anode: A strip or chunk of the impure metal.
- Cathode: A strip or chunk of the pure metal.
Using the example of copper refining:
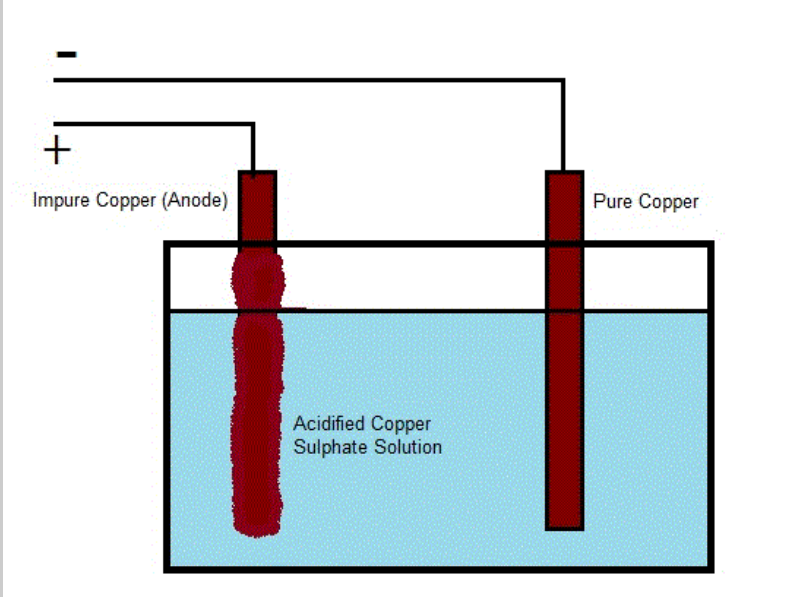 The anode in this diagram is a strip of impure copper. The cathode is a strip of pure copper. The electrolyte is an acidified copper sulfate solution.
When the current is turned on, the anode becomes positively charged, and the cathode becomes negatively charged.
The ions in the copper sulfate solution become delocalized and are split into its constituent ions, copper (Cu2+) and sulfate (SO42-).
The positive copper ions are attracted to the negative cathode, where they are reduced and form a layer of pure copper on top.
Electrorefining – Anode Ions and Anode Mud
The negative sulfate ions are attracted to the positive anode. The copper ions are oxidized and lose their electrons, dissolving into the solution and bonding with the available sulfate ions to replenish the lost copper. Other metal impurities that are easily oxidized may also dissolve into the solution, however, they are not easily reduced, unlike copper, and instead of being plated onto the cathode, fall to the bottom of the container, forming an anode mud or anode sludge.
Criterion D: The value of the metals derived from the anode mud, such as gold, silver, and platinum, make up for the cost of electrorefining.
Corrosion
Corrosion is a process through which a pure metal is converted into a chemically stable oxide, thus becoming an undesirable substance, due to chemical or electrochemical reactions with the environment.
In the electrochemical theory of corrosion, metals have an anodic part and a cathodic part. As a result, the metal atoms in the anodic part of the metal become oxidized and lose one of their electrons, which moves to the cathodic part of the metal. The electrons at the cathodic part react with the compounds in the atmosphere, forming ions. These ions then react with the metal ions in the anodic region, forming chemical oxides and causing corrosion.
Thus, the metal ions left behind in the anodic part of the metal react with ions in the surroundings to corrode.
This pdf explains it really well: Module-2-Dr.SMP-Corrosion-and-Metal-Finishing-Final.pdf
Rusting is a special type of corrosion that occurs only in iron, or iron alloys such as steel. Hence, it is inappropriate to say a metal has “rusted” when the metal in question is not iron or an iron alloy.
Rusting only occurs upon exposure to both air and water. Exposure to only one of the two will not result in rusting.
Prevention of Corrosion
Corrosion can be prevented through two types of methods: barrier methods and sacrificial methods.
Barrier Methods
Barrier methods involve preventing iron from coming in contact with oxygen and water in the first place. This includes, but is not limited to:
- Painting the metal: Paint creates a barrier between the surface of the iron and any moisture outside, preventing rusting.
Pros: Cheap, has aesthetic applications too.
Cons: Doesn’t work with water-based paints, doesn’t work if scratched or peeled off. - Oiling or greasing the metal: Applying a layer of oil or grease on top of the metal can accomplish the above, too. Oil is hydrophobic, hence, water won’t penetrate through the grease layer and corrode the iron. However, this only works for metal parts that are always moving, like a bicycle chain, as it acts as a lubricant and stays on the metal instead of flaking off like paint.
- Electroplating the metal: This is the process of using electrolysis to coat the reactive metal, like iron, with another metal. This could either be one that is less reactive, but forms a tough and durable layer on top, like nickel, or one that is extremely reactive and “sacrifices” itself to protect the iron, like zinc.
Sacrificial Methods
Sacrificial methods involve adding a more reactive metal like aluminum or zinc to the iron that will “sacrifice” itself to protect the iron (bro really thinks he’s the main character 💀💀). Thus, the more reactive metal is oxidized and is corroded in place of the iron.
Furthermore, connecting the metal to a more reactive metal means that the two different metals themselves become cathode and anode respectively. The more reactive metal supplies electrons to the less reactive metal, making it a cathode and protecting it from corrosion.
Galvanizing is a method that uses both sacrificial and barrier methods. It is the process of applying a protective zinc coating over steel or iron to prevent corrosion. Not only does the layer of zinc prevent moisture from reaching the iron in the first place, zinc is higher up on the reactivity series than iron. Thus, even if the zinc coating is scratched or damaged, it will react more readily with the moisture than iron, becoming a “sacrificial anode”.
Cathodic protection is also a method of protecting metals, particularly pipelines submerged underground and exposed to corrosive elements such as moisture in the soil, from corrosion. When it comes to metals in an electrochemical cell, the anodic part of the metal will corrode, while the cathodic part of the metal will not. Thus, by converting the metal into a cathode, corrosion can be prevented.
Impressed current cathodic protection involves connecting the anodic metal to an external power source such as a battery. This supplies a flow of electrons to the metal, making the rest of the metal a cathode and protecting it from external corrosion.
The Electrochemical Cell
An electrochemical cell is a device that generates electrical energy from the chemical reactions occurring in it, or vice-versa: it uses the electrical energy it receives from a power source to facilitate chemical reactions in itself.
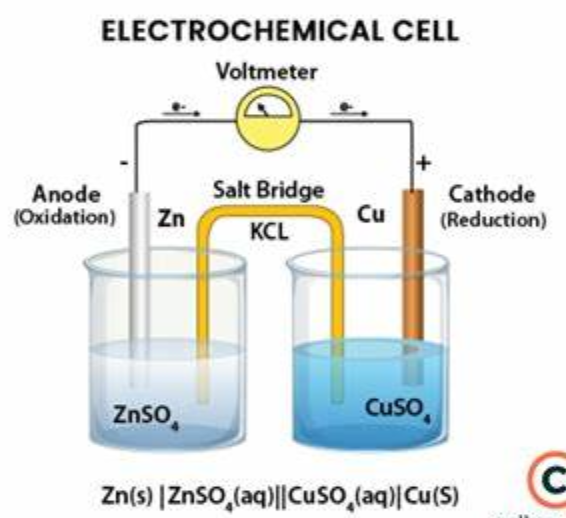
Cells which execute the former are called galvanic or voltaic cells.
Cells which engage in the latter are called electrolytic cells.
Parts of an Electrolytic Cell:
- Anode: The positively-charged electrode submerged in the electrolytic solution, which attracts negative ions, or anions, and is the site where oxidation occurs.
- Cathode: The negatively-charged electrode which attracts positive ions, or cations, and is the site where reduction occurs.
- Electrolyte solution: The liquid which conducts electricity in which the electrodes are submerged.
- Salt bridge (only available for galvanic/voltaic cells): As electrolysis occurs and electrons travel from the anode to the cathode, charges begin to accumulate in the electrolytes. For example, in the anode half cell, the zinc ions are oxidized, lose their electrons, and become Zn2+ ions, which slowly become more and more concentrated within the solution as time passes. Meanwhile, in the cathode half cell, the Cu2+ ions in the solution are reduced, gain electrons, and build up on the surface of the cathode, leaving behind a large concentration of negative SO4 ions in the solution.
Thus, the electrolyte in the anode half cell becomes positively charged, and the electrolyte in the cathode half cell becomes negatively charged.
As a result, despite electrons flowing from the anode to the cathode, the flow of electrons stops because negatively-charged electrons will not be attracted towards the negatively-charged electrolyte of the cathode half-cell, as charges repel.
Thus, the salt bridge, which contains an inert cation and anion, helps fix this problem by ensuring electrical neutrality. The cations in the salt bridge move to the electrolyte in the cathode half-cell, reducing the negative charge. Likewise, the anions in the salt bridge move to the anode half-cell and reduce the positive charge. Thus, the flow of electrons resumes.
These ions are inert and do not react with those in the electrolyte, thus not impacting the function of the electrolytic cell.
Voltmeter: Measures the voltage of the electrical energy generated from the chemical reactions.
IMPORTANT NOTE
In electrolytic cells, the anode is positive and the cathode is negative. However, in galvanic cells, the anode is negative and the cathode is positive. In galvanic cells, the anode is the less reactive element, and it is considered to be negatively charged as electrons move away from the anode to the cathode, and like charges repel each other, so negative repels negative, hence the anode is considered negative. Meanwhile, the cathode is the more reactive element, and is considered positive because it attracts electrons, and opposite charges attract, so positive attracts negative, hence the cathode is considered to be positive.
Galvanic/Voltaic Cells:
A cell that uses chemical energy to drive the flow of electrons– essentially, the stark opposite of an electrolytic cell.
Fuel Cells:
Fuel cells are cells that convert chemical energy (such as fuel) into electricity, making them a type of galvanic or voltaic cells. They differ from batteries on the grounds that they require a continuous source of fuel from the surrounding air, whereas batteries already contain fuel. They can supply fuel for longer as a result as long as a constant supply of air is maintained, whereas batteries will eventually cease to function as their fuel is drained and will need to be replaced, generating waste.
The typical principle behind the functioning of a fuel cell is that the fuel enters the cell and is oxidized, creating a potential difference (a difference of charge between the electrodes) across the cell. This difference in charge drives the flow of electrons, creating electricity.
The most common type is a hydrogen-oxygen fuel cell, which combines hydrogen fuel with oxygen to produce water and generate electricity in the process. In these types of fuel cells, the electrolyte is potassium hydroxide, with the electrodes themselves made of porous carbon which contains a catalyst to speed up reactions.
The hydrogen enters through the anode compartment, and the oxygen through the cathode compartment. The water and heat exits through an outlet in the cathode compartment.
First, the hydrogen is oxidized at the anode. The anode initially has a positive charge, which makes the positive hydrogen ions migrate to the cathode, which has an initial negative charge. This leaves behind the electrons in the anode, which gives the anode a negative charge. The concentration of H+ ions in the cathode gives the cathode a positive charge.
The electrons move through a wire, generating a current, before reaching the cathode.
Half-reaction: H2 → 2H+ + 2e-
At the cathode, the hydrogen and the electrons react with oxygen to produce water.
Half-reaction: O2 + 4H+ + 4e- → 2H2O
Combining both half-reactions and cancelling out the spectator ions, we are left with the net ionic equation of the reaction taking place in the fuel cell:
H2 + O2 + 4H+ + 4e- → 2H2O + 2H+ +2e-
H2 + O2 + 2H+ + 2e- → 2H2O
2H2 + O2 → 2H2O
Criterion D– Real-life Applications:
Since they only require a supply of air to function and don’t produce as much waste, hydrogen fuel cells have been used on spacecraft and space probes for decades.
They have also been installed as a source of backup power in places like hospitals and power plants. Waste treatment plants also use fuel cell technology to make use of the methane gas produced from decomposing garbage.
Using hydrogen-oxygen fuel cells in place of fossil fuels can have several benefits. They can be produced readily, as they only require hydrogen fuel and oxygen as the reactants. Furthermore, it doesn’t produce pollutants such as carbon dioxide as waste, only producing water. Additionally, it has a longer lifespan than the average battery, as well as less polluting to dispose of.
However, manufacturing hydrogen fuel requires energy which often comes from burning fossil fuels, negating any positive impact using fuel cells may have had. Furthermore, being a gas, hydrogen is harder and less efficient to store, and is explosive when reacting with air, making it dangerous as well.
Aluminum Oxide (Al2O3)
A.K.A. alpha-aluminum, alumina, alundum, or aloxide. Inorganic compound.
Reaction with sodium hydroxide (NaOH):
Produces sodium aluminate and water, like so:
Al2O3 + 2NaOH → 2NaAlO2 + H2O
Reaction with sulfuric acid (H2SO4):
A notable fact about metal oxides is their typically basic nature, however, aluminum oxide is amphoteric, meaning it is both acidic and basic. In this reaction, it acts like a base:
Al2O3 + 3H2SO4 → Al2(SO4)3 + 3H2O
Reaction with hydrochloric acid (HCl):
Reacts with heated dilute hydrochloric acid to produce aluminum chloride solution:
Al2O3 + 6HCl → 2AlCl3 + 3H2O
Applications:
- Used in sunscreen, as well as cosmetics such as lipstick, blush, and nail polish.
- A good catalyst that helps speed up chemical reactions.
- Purifies water.
- Abrasive found in sandpaper.
- Used in sodium vapour lamps.
Batteries
Batteries are devices that accept, store, and release electricity on-demand. Energy is stored as chemical potential energy and converted into electrical energy through redox reactions.
Dry Cells:
Dry cells are types of batteries with an electrolyte in the form of a thick paste in place of a liquid. The most common type of dry cell is a zinc-carbon cell, better known as a Leclanche cell. The electrolyte in this case is ammonium chloride jelly, obtained by combining ammonium chloride with starch and flour.
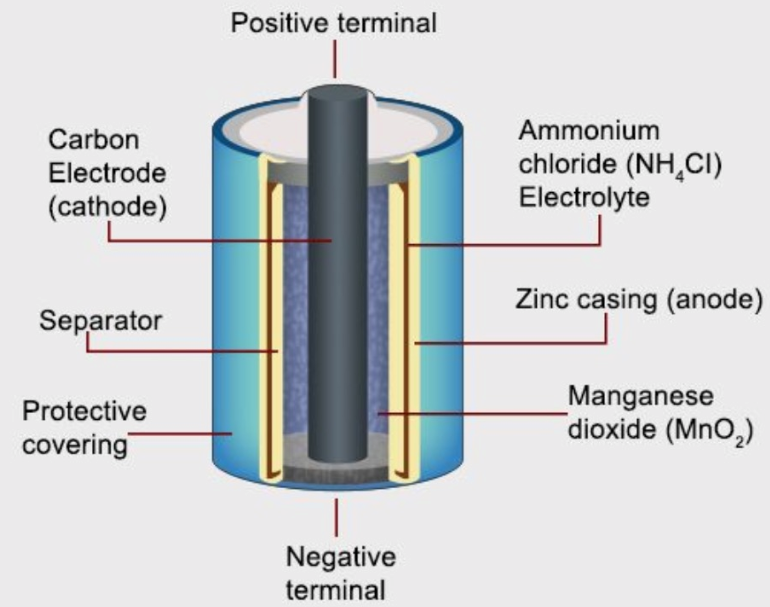
Electrons flow from the negative zinc casing, which acts as the anode, to the positive carbon electrode, however, it is the manganese dioxide that is reduced, NOT the carbon electrode.
Li-ion Batteries:
Li-ion batteries are a type of rechargeable battery which uses lithium ions, whose reduction is reversible, to store energy. When discharging, electrons move from the anode to the cathode, however when charging, they move from the cathode to the anode.
The cathode is lithium iron phosphate, or LiFePO4, while the anode is graphite, or C6.
When charging, the electric current from the charger reduces the lithium atom of the cathode, causing the ion to migrate through the electrolyte full of lithium ions to the anode and reunite with its lost electron, only to bind with the graphite to form lithiated graphite, or LiC6. When the battery is discharging, this reaction is reversed– the lithiated graphite is oxidized and the lithium ion bonds with the iron phosphate to form lithium iron phosphate once again.
System, Surroundings, and Reactions
In thermodynamics, the system refers to the substances involved in the reaction only, namely the reactants and products. The surroundings refers to anything not directly involved in the reaction, such as the container in which the reaction occurs. During a chemical reaction, energy is transferred between the system and the surroundings.
E is the internal energy of a system and the sum of all its kinetic and potential energies. In a chemical reaction, there is a change within E, which can be illustrated through the following equation:
EΔ = E(final) - E(initial)
Where E(final) is the final internal energy of the system, and E(initial) is the internal energy of the system before the chemical reaction takes place. ΔE represents the total change in the internal energy of the system.
If ΔE is negative, it means that energy is being lost from the system into the surroundings. However, if ΔE is positive, it means that energy is being gained by the system from the surroundings.
Systems can either be open, closed, or isolated.
Endothermic Reactions
Endothermic reactions are ones where energy is transferred from the surroundings to the system.
A good example of this reaction is that between ammonium nitrate and water. This is commonly seen in hand coolers, where both compounds are mixed. The following reaction is endothermic and heat is absorbed, creating a cooling effect.
This reaction is reversible, too! So yippee for reusable hand coolers!
Exothermic Reactions
Exothermic reactions are ones where energy is transferred from the system to the surroundings.
If E < 0, the reaction is exothermic.
If E > 0, the reaction is endothermic.
Type of System
| Type of System | Can matter enter or exit the system? | Can energy be transferred in and out of the system? | Exists in real life? |
|---|---|---|---|
| Open | ✔ | ✔ | ✔ |
| Closed | ⨯ | ✔ | ✔ |
| Isolated | ⨯ | ⨯ | ⨯ |
Energy transfers aren’t exclusive only to heat energy– even an insulated system can have energy transferred in and out of it through mechanical work done.
Thus, it is impossible for an isolated system to exist in real life, making it a purely hypothetical system.
Examples:
Open system: An open bottle filled with water.
- Mass (water) can be transferred in and out of the system by pouring it out or pouring more in.
- Energy (heat) can be transferred in and out of the system by feeling a warm sensation if you hold the bottle and the water is at a higher temperature.
Closed system: A closed bottle filled with water.
- Mass (water) cannot be transferred in and out of the system by pouring it out or pouring more in.
- Energy (heat) can be transferred in and out of the system by feeling a warm sensation if you hold the bottle and the water is at a higher temperature.
Activation energy is the minimum energy required for a reaction to take place.
Enthalpy and Heat Change
Enthalpy is the sum of a system’s internal energy and the product of the pressure exerted by it and its volume, and is most commonly written as a change in enthalpy, or:
ΔH = ΔU + (ΔP x ΔV)
Where ΔH = the change in enthalpy
ΔU = the change in internal energy
ΔP = the change in pressure
ΔV = the change in volume
Take, for example, a system which contains gas. If heat is added to the system, the gas will:
- Expand to fill the container, increasing in volume.
- Exert more pressure on the walls of the container.
- Have an increase in its internal energy.
Hence the formula above, which considers all three factors.
If pressure/conditions is/are kept constant, the change in enthalpy is equal to the heat evolved (meaning heat absorbed or released) by the system, or:
ΔH = q
Where ΔH = change in enthalpy
q = heat change
As a chemical reaction occurs, heat is evolved by the system, substances will increase or decrease in temperature. As a result, heat will flow from the substance to other objects surrounding it or vice-versa till a state of thermal equilibrium is achieved. If pressure remains constant, the heat change is an indicator of the change in enthalpy.
For example, if a fuel is burned in the air and 100 kiloJoules of heat are released, then the enthalpy of the system is reduced by 100 kiloJoules. Thus, the change in enthalpy for the system was -100 kJ, or ΔH = -100 kJ.
If the value of ΔH is negative, then energy is released from the system into the surroundings, and the reaction is exothermic.
If the value of ΔH is positive, then energy is absorbed by the system from the surroundings, and the reaction is endothermic.
H refers to standard enthalpy change, or the change in enthalpy under standard conditions.
Similarly, Hc is the standard enthalpy change of combustion. It is essentially a measure of the change in enthalpy of a combustion reaction, which is the amount of heat energy released by combusting a certain amount of the substance as calculated using a copper calorimeter, divided by the moles of the substance burnt.
Hc = Q / moles of substance burnt
To find the Q of a combustion reaction, consider a calorimeter (notes on this later on). The temperature change of water is used in the formula Q = mcΔT. The mass of water is calculated using the volume of water given and the density of water, which is set at 1g/cm³.
Finally, the specific heat capacity of the water is set at 4.18.
Heat change refers to the heat energy in Joules released or absorbed by 1 gram of a substance when its temperature is changed by 1 degree Celsius. Essentially, it’s the amount of heat absorbed or released by the substance by its specific heat capacity, and to calculate it, the following formula is used:
q = mcΔT
Where q = the amount of heat required to change the temperature of 1 gram of a substance by 1 degree Celsius.
m = the mass of the sample of substance
c = the specific heat capacity of the substance
ΔT = the final temperature of the substance - the initial temperature of the substance
Alternatively, to calculate the specific heat capacity of a substance, the formula can be tweaked as so:
c = q / mΔT
Enthalpy of Combustion
The enthalpy of combustion is the change in enthalpy (ΔH) or the amount of heat produced when 1 mole of a substance combusts (reacts vigorously with oxygen) under fixed conditions.
The heat released by the substance is equal to the negative enthalpy of the system, and is given by the following formula:
ΔHC=-(mcΔTn)
where n = the number of moles of the substance used in combustion.
n can be calculated through the following formula:
n = Given mass / molar mass
Bond Enthalpy
This is essentially the difference of the energy required to break the bonds of reactants minus the energy released in the formation of the bonds of the products, or:
Erequired to break bonds - Ereleased when bonds are formed = Bond Enthalpy of that reaction.
The energy required to break bonds will vary depending on the elements bonded to each other, or even the nature of the bond – is it a single bond, double bond, or triple bond?
To determine the nature of the bonds correctly, draw out a diagram first to avoid getting confused! For polyatomic ions that are used multiple times, identify a common bond and then multiply by how many times it is repeated. For example, for ammonium (NH4+):
There are 4 NH bonds, so the enthalpy can be calculated as 4(NH). If the ammonium ion is taken twice (NH4+)2, then you just double the number of NH bonds, so 8(NH).
The Rate of Reaction
A.k.a. the reaction rate. It’s the speed at which a chemical reaction proceeds, and is measured by the increase in concentration of products per unit of time and the decrease in the concentration of reactants per unit of time.
Factors Affecting Reaction Rate
- Temperature: If the temperature of a substance is increased, then the average kinetic energy of the particles of the substances involved in the reaction increases. As a result, the rate of collisions increases and the reaction rate increases.
- Concentration: The greater the concentration of each substance, the more particles of each substance are present within the system, and therefore the rate of collisions increases along with the reaction rate.
- Surface Area: Increasing the surface area of the reactants increases the area of the substances available to react with, thereby increasing the rate of collisions and the rate of reaction as a whole.
Catalysts and Inhibitors
A catalyst is a substance that participates in a reaction without being used up, unlike the reactants, and serves to speed up the rate of reaction by lowering the activation energy of the reaction. It accomplishes this by providing an alternative pathway through which the same products can be formed but with a smaller activation energy.
Inhibitors are the opposite of catalysts. Though they, too, are not used up in the reaction, they serve to slow down the rate of reaction instead of speeding it up.
Real-life applications: Medicines often work this way by inhibiting faulty, damaged, or harmful enzymes in the body from functioning.
Speaking of them, enzymes are biological catalysts which serve to increase the rate of biological reactions. Within the human body, the temperature is far too low for biological reactions crucial to life to occur at the desired rate. Increasing the body’s temperature could be downright fatal, hence, the body uses enzymes to speed up the rate of reaction without increasing the temperature.
This aids in processes such as the digestion of food, production of new cells, and even the clotting of blood.
Types of Reactions
Slow reactions are those which take an extremely long time to complete, often years or decades, and as a result have a low rate of reaction.
Moderate reactions are ones which, as the name suggests, take a moderate amount of time to complete (wow what a shocker, could never have guessed that one), ranging from hours to a few minutes, and have a moderate rate of reaction.
Fast reactions are those which are completed in a matter of seconds or less, and thus have a high rate of reaction and an extremely low activation energy. These include the combustion of a match or the petrol in a car’s engine.
Irreversible and Reversible Reactions
| Irreversible | Reversible |
|---|---|
| These are irreversible, and can never be undone. | These reactions, as the name suggests, can be reversed, where the products can react with one another to form the reactants once again. |
| Ex:- The burning of paper is irreversible. It produces carbon dioxide and water vapour, which cannot be turned back into paper. | Ex:- The heating of hydrated copper sulfate crystals produces water vapour and white anhydrous copper sulfate. If the water lost is re-added, the hydrated copper sulfate can be reformed. |
| Equation: CuSO4·5H2O ⥦ CuSO4 + 5H2O | Another example is heating mercury (II) oxide to form liquid mercury and oxygen gas. Upon cooling, the products react with one-another to produce mercury (II) oxide again. |
| Equation: 2HgO (s) ⥦ 2Hg (l) + O2 (g) |
Dynamic Equilibrium
In reversible reactions, the reaction where the reactants are converted into the products is called the forward reaction, and the reaction where the products are converted back into the reactants is called the backward reaction.
For example, in the reaction 2HgO (s) ⥦ 2Hg (l) + O2 (g):
- 2HgO → 2Hg (l) + O2 (g) is the forward reaction.
- 2Hg (l) + O2 (g) → 2HgO is the backward reaction.
Both of these reactions occur at different rates or speeds. At the beginning of the reaction, the concentration of the reactants is large, while the concentration of the products is zero. In the case of the above reaction, there is a large amount of mercury oxide (2HgO) present, but no liquid mercury and oxygen gas (2Hg (l) + O2 (g)).
Hence, the reaction rate for the forward reaction is high as the reactants are decomposed into the products, but the reaction rate for the backward reaction is low because there are no products yet to be converted back into the reactants.
As the reaction proceeds, the concentration of products increases and the concentration of reactants decreases. In this case, there is now a larger amount of liquid mercury and oxygen gas, but a smaller amount of mercury oxide.
As a result, the backwards reaction can now commence due to the greater concentration of products. Hence, the reaction rate for the backwards reaction is high, while the reaction rate for the forwards reaction is low.
Over time, the reaction rate for both the forward and backward reactions will even out. Meaning, the decrease in the concentration of reactants and increase in the concentration of products per unit of time will be equal to the decrease in the concentration of products and increase in the concentration of reactants per unit of time.
As a result, the concentrations of the products and reactants will not change, as for every unit of product consumed to form the reactants, a proportional unit of reactants is consumed to form the products. Essentially, both reactions cancel themselves out and there is no net change in the concentration of either reactants or products.
!!IMPORTANT: Note that the concentrations of the products and reactants will remain constant, but this does not mean that they are equal. Or, to put it visually:
- Constant concentration of reactants and products
- Equal concentration of reactants and products
Even at equilibrium, there could be a large concentration of mercury oxide and only a small concentration of liquid mercury and oxygen gas, but as long as these concentrations do not change and reactions are still occurring, then the reaction has achieved a state of dynamic equilibrium.
However, the concentrations of the reactants and products determine the position of equilibrium. It describes the relative concentrations of reactants and products when the reaction is at dynamic equilibrium.
If the equilibrium lies to the right, it means that at equilibrium, the concentration of products is relatively greater than the concentration of reactants.
If the equilibrium lies to the left, it means that at equilibrium, the concentration of reactants is relatively greater than the concentration of products.
Equilibrium can only be reached in a closed system so that neither the mass of the reactants or the products can escape.
The position of equilibrium can be influenced by temperature, pressure, and the presence of catalysts.
Le Chatelier’s Principle:
Le Chatelier’s principle is as follows: “If the equilibrium of a system is disturbed by a change in one or more of the determining factors (as temperature, pressure, or concentration) the system tends to adjust itself to a new equilibrium by counteracting as far as possible the effect of the change.”
Temperature:
Let’s take the sample reversible reaction N2 (g) + 3H2 (g) ⥦ 2NH3 (g). Assuming that the reaction is conducted under constant conditions, the enthalpy of the reaction is equal to the heat evolved by the system, which is: ΔH = -92 kJ
This can be understood to mean that the enthalpy of the forward reaction, or N2 (g) + 3H2 (g) → 2NH3(g), is -92 kJ. As the enthalpy is less than zero, heat is removed from the reaction and released and the forward reaction is exothermic.
Hence, it can be assumed that the backward reaction, or 2NH3 (g) → N2 (g) + 3H2 (g), is endothermic, and an identical amount of heat is added to the system.
Though this is technically incorrect to write in the actual exam, let’s take heat as another reactant consumed as a result of the backward reaction. We get:
2NH3 (g) + heat → N2 (g) + 3H2 (g) (don’t write this in the exam! Or if you do, don’t throw me under the bus, you did this to yourself.)
Now, let’s turn up the heat– literally. Let us increase the temperature of the system. This means that more heat is added to the reactant side of the equation, or:
2NH3 (g) + even more heat → N2 (g) + 3H2 (g)
All this excess heat needs to be used up by the reaction, so it conducts the heat-absorbing reaction, or the endothermic reaction, at a faster rate or speed than the heat-releasing reaction, or the exothermic reaction. This is because we don’t need more heat to be released, we need it to be absorbed.
In the case of this reaction, the endothermic reaction is 2NH3 (g) + heat → N2 (g) + 3H2 (g), and it happens at a faster rate, compared to the exothermic reaction of N2 (g) + 3H2 (g) → 2NH3 (g) + heat.
Thus, equilibrium is achieved in the sense that the concentration of neither the reactants nor the products changes, but the speed at which each reaction occurs does change.
As the backward reaction is occurring at a faster rate compared to the forward reaction, the position of equilibrium has shifted to the right.
Concentration:
If the concentration of products in a system is increased, then the backward reaction is favoured to use up the additional products. This also occurs if the concentration of reactants is decreased, as the backward reaction is favoured to produce more reactants.
If the concentration of reactants in a system is increased, then the forward reaction is favoured to use up the additional reactants. This also occurs if the concentration of products is decreased, as the forward reaction is favoured to produce more products.
Pressure:
If the volume of a system, or the gas in this case, (not the surroundings, which in this case means the container) is decreased, the pressure it exerts on the walls of the container is decreased as the number of gas molecules colliding with the walls of the container is decreased, and vice versa: if the volume of a system (gas) is increased, then the pressure increases as there are more gas molecules colliding with the walls.
Let’s take the example of a reversible reaction resulting in the formation of gaseous compounds: dinitrogen tetroxide reacts to form nitrogen dioxide, or N2O4 ⥦ 2NO2.
The forward reaction is endothermic and absorbs heat to break bonds holding together dinitrogen tetroxide molecules to form nitrogen dioxide. Hence, the backward reaction is exothermic and releases heat as nitrogen dioxide molecules bond together to form dinitrogen tetroxide once again.
Thus, the forward reaction produces a greater volume of gas, and thus results in an increased pressure. The backward reaction counteracts this by producing a smaller volume of gas and thus producing a decreased pressure.
However, if additional pressure is added to the system, then the reaction which produces a decreased pressure is favoured to counteract this disturbance.
Thus, the backward reaction is favoured, and the position of equilibrium shifts to the right.
The opposite occurs if pressure is removed from the system. Then, the reaction which produces an increased pressure is favoured to counteract this.
Thus, the forward reaction is favoured and the position of equilibrium shifts to the left.
The Haber Process:
Despite the air around us being 78% nitrogen, plants can’t use it unless it’s in the soil, typically as ammonia. But with the world’s population rapidly increasing, and the need to feed everyone more important than ever, increasing crop yield for food is more crucial than ever.
Enter German chemist Fritz Haber, whose titular Haber process revolves around the simple reversible reaction of nitrogen, hydrogen, and ammonia:
N2 (g) + 3H2 (g) ⥦ 2NH3 (g)
This reaction is the reason why you and many others have food on their table today.
The Haber process relies on a reversible reaction, meaning ammonia can be decomposed back into nitrogen and hydrogen gas. However, to maximize the output of ammonia, Haber utilized Le Chatelier’s principle by adjusting the pressure and temperature at which the reaction takes place to achieve a state of dynamic equilibrium where the forward reaction is favoured.
Stages:
The reactants of nitrogen and hydrogen gas are taken. Nitrogen is extracted from the atmosphere, where it is in plentiful supply. Hydrogen is taken from natural gases that contain hydrocarbons like methane. Thus, the Haber process uses up 3-5% of the natural gas produced globally.
Both gases are fed into a compressor, where more and more of both reactants are added till the pressure they exert is equal to 200 atm.
The mixture of gases is moved into the reaction vessel, where they are heated till 450℃. The reaction vessel also contains iron catalysts to speed up the reaction. The catalysts speed up both the forward and backward reactions equally, increasing the reaction rate. Otherwise, it would take an extremely long period of time to achieve equilibrium. The gases react to form ammonia.
The ammonia, along with the unreacted gases, is sent to a cooling tank. The ammonia, as it has a low boiling point, is rapidly cooled to a liquid and extracted for use.
The unreacted nitrogen and hydrogen, as they have higher boiling points, remain as gases and are fed back into the compressor to be reacted again. This is done to increase the yield of ammonia and minimize waste.
The Haber Process (continued):
Temperature:
The Haber process is always conducted at a temperature of 450℃. The temperature is sufficiently high that the reaction rate of the particles is high enough for particles to react with one another at a fast enough rate. If the temperature is too low, it would take an extremely long time to reach equilibrium.
However, it’s also low enough to favour the reaction that releases heat, or the exothermic reaction, to compensate for the low temperature.
In this case, the forward reaction, N2 + 3H2 → 2NH3, is exothermic, as it releases heat to form bonds between nitrogen and hydrogen to make ammonia. Thus, it is favoured and the concentration of ammonia produced increases.
Pressure:
The volume of the mixture of gases involved in the Haber process is increased till the pressure of the system reaches 200 atm.
The pressure exerted by a system of gases on the walls of the container is directly proportional to the volume of the gas. Thus, to counteract the high pressure, according to Le Chatelier’s principle, the reaction which produces a smaller volume will be favoured.
In this case, the forward reaction, N2 + 3H2 → 2NH3, produces a smaller volume as 2 molecules of nitrogen gas and three molecules of hydrogen gas combine to form only 2 molecules of ammonia. Thus, it is favoured and the concentration of ammonia produced increases.
Real-life Applications:
- Dyes: Ammonia is used in hair dye to help the dye penetrate more evenly through the hair, resulting in a stronger, long-lasting colour.
- Nitrogen-based fertilizers: As initially mentioned, the Haber process was used to extract ammonia from the atmosphere to use in nitrogen-based fertilizers. Essentially, this made nitrogen more accessible to plants, boosting crop yields and the productivity of agricultural plots of land.
- If the low productivity of crop yields produced in the 1900s was maintained in the 21st century, four times more land would be required to feed the population. Furthermore, the land used for cultivation would cover half of all the land available today save for Antarctica and the Arctic. Instead, thanks to the Haber process, agricultural land only makes up less than 20% of total land area in most countries.
- Explosives: Nitric acid (HNO3) could also be produced from ammonia, and is a key component in explosives.
Drawbacks:
- Costly: Generating a temperature higher than 450℃ is costly due to the amount of fuel needed to be burnt. Thus, it is kept at that temperature to balance costs as well. Furthermore, increasing the pressure exerted by the system beyond 200 atm is not only very costly due to the amount of reactants needed to be extracted, but also unsafe, as the container could burst open and cause damage.
- Could be used for harm: The ammonia generated from the Haber process was used to produce nitric acid, a key component in explosives. The Germans used this to produce explosives in World War II and kill millions.
- Wastage of nitrogen: Plants can only use so much nitrogen to produce an efficient crop yield. As a result, excess nitrogen in the fertilizer runs off from crop yields and builds up in natural environments, causing harm. Furthermore, nitrogen builds up in the biosphere and gets released sparingly into the atmosphere, disrupting the natural nitrogen cycle.
- Eutrophication: Nitrogen runoff from agricultural areas into nearby water bodies creates “dead zones” as algae outcompete fish for oxygen and block light from entering below.
- Nitrous oxide emissions: Nitrous oxide (N2O), commonly known as laughing gas, also has a greenhouse effect on the environment, contributing to global warming. It is commonly produced as a byproduct of the Haber process.
Calorimeters:
Calorimeters are devices which measure the energy absorbed or released as heat during a physical or chemical change. This is used to measure the energy content of food.
These are insulated vessels with a reaction chamber where reactants are placed and sealed in. This chamber is surrounded by a layer of water, and then, a layer of air, to ensure little to no heat escapes into the surroundings. The reaction takes place in the “bomb”, which is the reaction chamber of the calorimeter. The heat is either absorbed or released in the reaction, which will cause the temperature of the surrounding water to decrease or increase respectively.
The change in the temperature of water is proportional to the amount of heat transferred, which is measured in joules (J) of energy.
The greater the calorific value, or the amount of heat released per unit of fuel, of a fuel, the less fuel is consumed overall.