Geography
Impacts and Management of Natural Disasters
Focus: Especially in Tectonically Active Areas
Key Concepts (KC): Global interactions
Related Concepts (RCs): Patterns and trends, Causality, Management & Intervention
Global Context (GC): Scientific and Technological Innovation
Content: Natural Disaster Definition, Types of Natural Disaster (Weather-related and Seismic activity-based)
Case Studies: Bangladesh, Japan, Pacific Ring of Fire, Nepal, Middle East, Greece, and Spain
A natural disaster is the harmful impact of natural phenomena rather than human-driven actions, causing devastating effects on individuals and communities, such as loss of life, destruction of infrastructure, environmental damage, and displacement.
Weather- and Climate-Driven Disasters
- Africa: $5B losses, 15% of global weather/climate disasters, 60% floods, droughts caused 95% deaths.
- Asia: $2T losses, 31% of global weather/climate disasters.
- South America: $39.2B losses, 59% floods.
- North America + Caribbean: $1.7T losses, 38% of global.
- South West Pacific: $88.2B losses.
Seismic Activity

- Continental-Continental: Fold mountains (e.g., Himalayas)
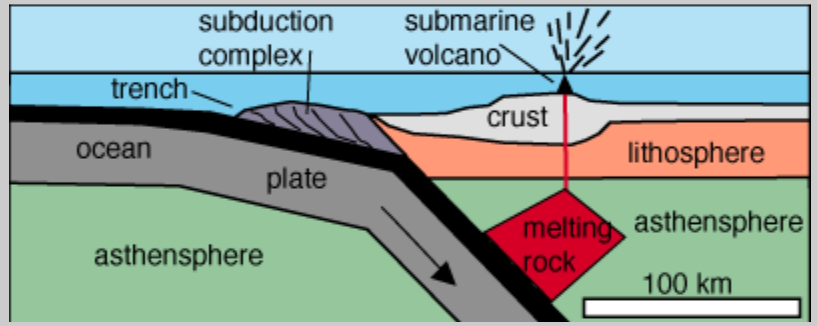
- Oceanic-Continental: Oceanic plate subducts, forms volcanoes, earthquakes due to friction
Earthquakes
- P-waves: Primary longitudinal waves, move through solids & liquids.
- S-waves: Secondary transverse waves, only through solids, more destructive.
- Surface waves: Love (shearing zig-zag motion) & Rayleigh (elliptical rolling motion).
- Intensity: Relative shaking, based on human observation, location-dependent.
- Magnitude: Numerical measurement, seismograph-based, constant with distance. Measured via Richter or Moment Magnitude Scale.
Responses to Earthquakes
- Prediction: Seismometers, tiltmeters, remote sensing (InSAR), GIS hazard mapping.
- Protection: Earthquake-resistant buildings, rubber shock absorbers, flexible pipelines, open evacuation areas, land use planning.
- Preparedness: Drills, education, training, communication in local language.
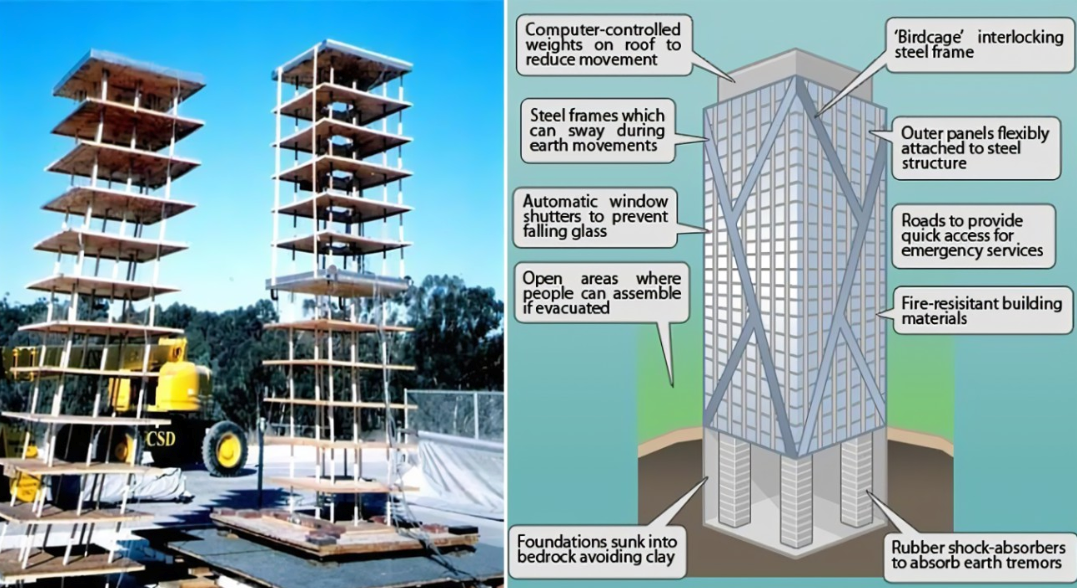
An earthquake-resistant building example.
2010 Haiti Earthquake
- Transform fault along the Caribbean Plate and North American Plate near Haiti
- Epicentre close to Port-au-Prince
- Shallow hypocentre (10 km beneath surface)
- 7.0 magnitude earthquake on Richter Scale
- Lack of land-use zoning and building codes
- Poverty: average income < $2/day, limiting earthquake-resistant construction
- Corruption: contractors build on unstable land
- Poor infrastructure: majority live in shantytowns
- U.N. agency buildings damaged, affecting aid and medical treatment
- Damage to seaports obstructed rescue operations
- Communications infrastructure heavily damaged
- 1-3% of population killed
- Lack of earthquake-resistant structures caused building collapses
- Cholera outbreak introduced via U.N. volunteers and Peacekeepers
- Recovery efforts created large volumes of plastic waste, clogging drainage
- Homelessness and long-term infrastructure loss
- $3.06 billion donated by private donors to U.N. agencies
- Only 48% of aid reached Haiti; delays and redirection of funds
- Canada and Dominican Republic accepted Haitian refugees
- OpenStreetMap improved mapping using satellite images
- Search-and-rescue, food aid, and medical teams from around the world
Tsunamis
- Underwater earthquakes displace large water volumes
- Volcanic eruptions and landslides also displace water
- Energy travels from seafloor through deep pelagic zone to surface-level benthic zone
- Shallow areas cause wave height to increase (destructive)
- Long backswash occurs before wave arrives
- Local: ≤100 km from shore; less devastating but <1 hour warning
- Regional: ≤1000 km from shore; 1–3 hour warning
- Distant / Tele-tsunami: >1000 km from shore; most devastating
- 9.1 magnitude earthquake, 900 km away from affected areas
- 230,000 deaths; >500,000 displaced
- Tele-tsunami affected South India & East Africa
- Subduction of Indo-Australian plate under Eurasian plate
- Water traveled ~2 km inland in Sumatran coast
- Consequences: PTSD, cholera, dysentery, typhoid, reduced tourism, change in day length (2.368 sec)
- NGOs provided 11,000 shelters; basic aid due to LEDC status
- Tsunami Alarm System: seismic detectors, GSM alerts
- D.A.R.T. buoys: buoy, anchor, tsunameter; detect abnormal water pressure, transmit data via satellite
2011 Tohoku Earthquake & Tsunami
- Subduction zone earthquake: Pacific plate subducted under Okhotsk plate
- Okhotsk plate stuck, pressure buildup, seafloor uplift
- Seismic wave release caused drop in seafloor, displacing water → tsunami
- Waves reached Honshu coast in under 30 minutes
- Japan located on complex plate boundary with many fault lines
- Sparsely populated initial area → fewer casualties
- Shallow hypocenter: 32 km depth
- 9.0 magnitude earthquake
- Fukushima nuclear disaster: flooding, reactor meltdown, radioactive release
- 16,000 deaths, 6,000 injured
- Loss of property & infrastructure, lack of clean food, water, fuel
- $316 billion economic damage (excluding private sector)
- North & South America affected: waves reached South America ~21h later, North America 6–9h later
- Power blackouts due to nuclear loss, food shortages, radiation contamination
- Difficult rebuilding: missing leadership, mental trauma, environmental damage
- Loss in sales & production of Japanese companies
- Assistance from 163 countries
- Operation Tomodachi (U.S.) – aid mission
- Japanese Self-Defense Forces for search & rescue and clearing roads
- Red Cross and other organizations provided relief
- Team Fortress 2 in-game donations (yes, really!)
Volcanoes
- Shield volcanoes: broad, low-profile, fluid lava, frequent eruptions, dormant periods, hotspots
- Stratovolcanoes: steep, conical, layers of erupted material, explosive eruptions, lahars
- Cinder cones: small, steep-sided, loose pyroclastic material
- Dome volcanoes: thick, fast-cooling lava, dome-shaped
- Fissure volcanoes: simple cracks, non-explosive
- Caldera volcanoes: violent, explosive, bowl-shaped depression
- Magma chamber/reservoir: source of magma
- Opening/vent/fissure: surface exit for magma
- Crater: bowl-shaped depression at summit
- Lava flows: molten rock streams down slopes
- Pyroclastic material: ash, gas, rock fragments; includes pyroclastic flows
- Ash clouds: travel long distances, affect air quality, contribute to acid rain
- Crater lakes: formed in calderas after eruption
- Parasitic cones: secondary vents affecting volcano shape
- Flank: sloping sides built from eruptions
- Icelandic: lava mixes with ice, empties into oceans
- Hawaiian: step-like structures, frequent eruptions, material blown off forms steps
How Volcanoes Are Formed

> The red dots represent volcanoes.
- Denser oceanic crust forced beneath lighter continental crust
- Subducted crust melts into magma in the mantle
- Two plates move apart, magma rises from mantle and solidifies into mid-ocean ridges
- Underwater volcanoes can emerge above sea level
- Volcanoes far from plate boundaries (e.g., Hawaii)
- Formed by magma plumes beneath Earth’s crust
- As a plate moves over a plume, multiple volcanoes or islands form (island chains)
How Volcanic Eruptions Occur
- Pyroclastic flows: Avalanches of ash, gas, and hot material, up to 1500°F, impossible to outrun
- Lahars/mudflows: Currents of mud, sand, rock, ash, water; coarse debris moves at top speeds, depositing mud downstream
- Geothermal energy: Extract energy from magma; first 10 km below U.S. soil contains 3.3 × 10^25 joules (~6,000x world oil reserves)
- Ash as fertilizer: Long-term soil enrichment aiding agriculture
- Tourism: Volcanoes attract tourists (e.g., Bali)
Impacts of Volcanoes
- Social: Casualties, displacement, property damage
- Environmental: Air/water contamination, habitat destruction
- Economic: Reconstruction costs, loss of income, emergency response costs
- Political: Unrest, riots, looting if law enforcement disrupted
- Social: Mental health issues, cultural site destruction, increased homelessness
- Environmental: Greenhouse gas emissions contribute to global warming
- Economic: Disruption of economic growth, deeper economic divide
- Political: Introduction of disaster management policies, improved evacuation and relocation strategies
Responses and Preparedness
- Evacuation
- Emergency aid and medical facilities
- Search-and-rescue operations
- Land use zoning and relocation
- New building codes
- Education, training, safety drills
- Preparedness: Early warning messages, safety drills (e.g., Philippines text warnings)
- Mitigation: Redirect lava flows, construct protective barriers (e.g., Iceland “volcano wall”)
- Adaptation: Change lifestyle post-disaster (e.g., Montserrat promoting tourism)
- InSAR: Track ground deformation, gas emissions, heat signatures, ash plumes
- Gas sensors and drones: Safer, cheaper monitoring
- Volcanic alert systems (e.g., VNS in Hawaii) with color-coded warnings
Flooding
- River floods (e.g., Musi River)
- Urban floods (poor drainage, Mumbai, Chennai)
- Flash floods (rapid low-lying area inundation)
- Coastal floods (cyclones in Bay of Bengal)
- Natural: Heavy rainfall, snowmelt, storm surges, tsunamis
- Human-aggravated: Deforestation, poor urban planning, dam failures, climate change
- Environmental: Soil erosion, water contamination, habitat destruction, sedimentation
- Social: Displacement (e.g., 5.7M in 2020 Assam floods), waterborne diseases, infrastructure damage
- Economic: Loss of agriculture, workplaces, productivity; India loses ~Rs. 95,000 annually
- Mental trauma and PTSD
- Constructing and preserving wetlands to absorb excess water
- Wetlands as carbon sinks, recreational areas, biodiversity support
Cyclones
- Uneven solar heating → low pressure at tropics, high pressure at poles
- Warm air rises over oceans, condenses into clouds, releases heat
- Coriolis force from Earth’s rotation deflects air, causing spinning motion (~15° deflection/hour)
Anatomy of a Cyclone
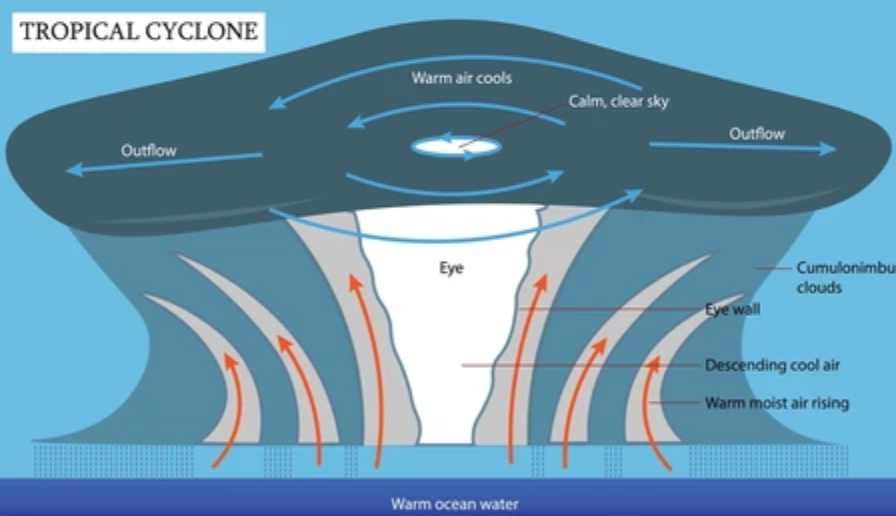 The Eye:
- Low-pressure region at the centre attracting cool, high-pressure air
- Warm air rises, creating a vacuum; cool air rushes in, heats, and rises again
- Some air cools and sinks, creating fair weather in the eye
- Ring of dense condensation around the eye
- Contains most severe thunderstorms and heavy rainfall
Why Cyclones Are So Deadly
- Making landfall cuts off moisture supply → cyclone weakens but is most destructive on shore
- Strong winds uproot trees and destroy property
- Storm surge pushes ocean water inland
- Heavy rain causes flooding, soil erosion, mudflows, landslides, infrastructure damage
- Classified on a scale of 1–5; Category 5 causes near-total destruction
Impacts of Cyclones
- Coastal erosion
- Saltwater intrusion contaminates freshwater sources
- Loss of vegetation and habitats
- Marine disruption – sediment chokes coral reefs
- Heat distribution: cyclones move heat from equator to poles
- Casualties and mental trauma
- Damage to infrastructure and communications
- Health risks due to poor sanitation and stagnant water
- Displacement and overcrowding in shelters
- Immediate and long-term losses from industry destruction and lost tourism
- Redirection of funds to recovery
- Damage to workplaces → loss of income
GIS in Cyclones
- Predict risk potential for objects/assets → informs insurance and evacuation decisions
- Example: TROPCYC assigns hazard risk to assets using cyclone data
- Cyclone Warning Dissemination System: satellite alerts to vulnerable areas
Cyclone Case Studies
- GIS used for planning and evacuation to avoid traffic congestion
- Real-time path monitoring and prioritization of evacuations
- High-quality satellite imagery helped post-disaster planning
- 4.9M displaced, $13.5B economic damage
- Exposed poor urban planning in coastal regions
- Impact: 128 deaths, 1M homes destroyed, saltwater intrusion in Bangladesh, agricultural losses
- Response: cyclone preparedness, evacuation, need for cyclone-resistant housing, restoration of Sundarbans
- Background vulnerabilities: underestimation, high tide, dense population, lack of natural barriers
- Short-Term Impacts: 138,000 deaths, 80–90% homes destroyed, homelessness, diarrhea and respiratory issues, livestock loss
- Long-Term Impacts: contamination of drinking water, destruction of farms, gender disparities in casualties
- Response: Operation Sea Angel (international aid), reforestation, elevated shelters, BISAP program for reconstruction and WaSH facilities
LEDCs vs MEDCs
- Planning: MEDCs prioritize preparedness, LEDCs focus on recovery
- Immediate Response: MEDCs faster response, LEDCs slower due to limited infrastructure
- Preparation vs Recovery: MEDCs invest in early warning, LEDCs adapt post-disaster
Disaster Management Cycle
International Disaster Management Frameworks
- Promote individual state responsibility + global collaboration
- Inclusive, non-discriminatory disaster planning
- Improve local access to hazard knowledge
- Five priorities: Risk reduction priority, know risks & act, awareness building, reduce risk, preparedness
- Guiding principles: shared responsibility, inclusivity, address underlying risk factors
- Main outcome: reduce disaster risk and asset loss
- Main goal: prevent new/emerging risks and reduce existing risks
- Four priorities: Understand risk, strengthen governance, invest in DRR, enhance preparedness
- Seven targets: reduce mortality, reduce nonfatal impacts, reduce GDP losses, reduce infrastructure damage, increase DRR strategies, increase international cooperation, increase early warning access
Unit 2 – Climate Change: The Melting Hourglass
Related Concepts: Systems and Sustainability
Global Context: Orientation in Space and Time (Scale, Duration, Frequency, and Variability)
Inquiry Questions
Factual:- What is the difference between weather and climate?
- What scientific evidence supports the existence of climate change?
- What are the natural and human-induced causes of climate change?
- How do the scale, duration, and frequency of climate events vary across regions and time?
- How do climate shifts impact environments and societies differently in LEDCs and MEDCs?
- Can international agreements effectively address the variability and scale of climate change impacts?
What is Climate Change?
Climate change is the long-term alteration of temperature and typical weather patterns across the globe or a particular location. Symptoms: unpredictable weather patterns, higher temperatures, more frequent/severe natural disasters.
Note: Climate change is NOT the same as global warming! Global warming is an effect of climate change.
Climate change can be local, regional, or global. Local = city/town, regional = country/area, global = entire planet.
Factors Affecting Climate and Weather

- Sunlight: Must pass through the atmosphere, mainly the troposphere (where weather occurs). Ozone layer filters harmful UV radiation.
- Atmosphere Layers:
- Troposphere: Weather, greenhouse gases
- Stratosphere: Ozone layer
- Mesosphere: Meteors burn, colder higher up
- Energy Balance: Absorption, emission, reflection → Earth’s energy budget (ideally 51% absorbed to maintain life)
- Earth’s magnetic field deflects solar radiation, affected by human activities like drilling and geothermal power
Greenhouse Gases & Radiation
Ozone absorbs shortwave radiation (UV), greenhouse gases absorb longwave radiation (infrared).
- Carbon Dioxide: Fossil fuels, deforestation, industry
- Methane: Agriculture, livestock, landfills, natural gas
- Water Vapour: Positive feedback loop – more heat → more evaporation → more heat trapped
Greenhouse gases maintain an average of 14°C on Earth, but excess leads to global warming.
Evidence for Climate Change
- Rising global temperatures
- Rising sea levels from melting glaciers
- Changes in precipitation patterns → more flooding
- Increased extreme weather events (cyclones, floods)
- Ocean acidification → coral reef damage
Natural Causes of Climate Change
- Sunspot Activity & Solar Flares: Affect solar radiation reaching Earth (~11-year cycle)
- Albedo Effect: Reflection of sunlight; melting ice or deforestation reduces reflectivity (
 )
) - Volcanic Activity: Aerosols cool the planet (e.g., Mt Pinatubo 1991)
- Ocean Currents: Distribute heat; slowing currents (AMOC, Southern Ocean) disrupt climate
- Methane Release: From wetlands and melting permafrost → positive feedback loop
Global Pressures & Wind Circulation
- ITCZ (InterTropical Convergence Zone): Equatorial low-pressure, rising air, frequent rain, doldrums (little horizontal wind)
- Horse Latitudes/Subtropical Highs: High pressure, sinking air, deserts (Sahara, Kalahari), weak winds
- Hadley Cells: Convection cells created by rising equatorial air and sinking subtropical air
Climate Agreements & Organizations
- UNEP: 1972, Stockholm Declaration – first environmental protection declaration
- IPCC: 1988, UNEP + WMO, condenses climate research into reports
- UNFCCC: 1992, 154 countries, annual COP meetings, 2015 Paris Agreement
Key International Agreements
- Paris Agreement (2015): Limit global temperature rise to 1.5°C; voluntary national plans; Green Climate Fund $100B target
- Kyoto Protocol: Predecessor to Paris, legally binding emission targets
- Stockholm Declaration (1972): States’ rights vs international governance
- Montreal Protocol + Kigali Amendment: 1987, combat ozone depletion (CFCs), Kigali 2016 added HFCs → tackle climate change too
Case Study: China
Example of a country implementing climate policy to reduce emissions, invest in renewable energy, and participate in international agreements.
Additional Resources
Video: https://youtu.be/Z5YvjG4lTpQ
Unit 2 – Climate Change: Environmental Degradation & Sustainable Solutions
Background and Environmental Degradation: China
China’s rapid industrialization, particularly during the “Chinese Economic Miracle”, led to a massive industrial boom. The country’s energy consumption rose dramatically—from 35% of the U.S.’s annual consumption in 1990 to 135% in 2023—and consumed 26% of global energy. Coal-fired power plants proliferated, leading to massive carbon emissions. According to the World Economic Forum, the energy sector produces 90% of China’s greenhouse gas emissions.
Urban areas like Beijing burned tons of coal each winter for heating, contributing to greenhouse gas emissions. Rural households still relied on firewood (44%) and coal (24%) as primary fuel sources, causing AQI scores to plummet. In December 2007, Beijing’s AQI reached a maximum of 500 (National Geographic).
Environmental Restoration
China’s environmental comeback is notable. Initiatives such as the Five-Year Plans (FYPs) progressively targeted renewable energy and pollution control. The 9th FYP (1996) highlighted renewable energy targets, the 13th FYP (2016) demanded 15% non-fossil energy and 675 MW of renewable capacity by 2020, and the 14th FYP (2021) focused on wind, solar, and hydropower storage.
The Energy Law (2020) prioritized low-carbon energy, integrated environmental costs into project planning, and encouraged public-private partnerships and local participation.
The Traffic Light System categorized provinces (red, orange, green) to regulate coal plant construction, prioritize renewables, and cap coal energy. Beijing launched coal-to-electric heating programs, factory emission regulations, and grassroots initiatives surveying residents.
The Air Pollution Prevention and Control Action Plan (APPCAP, 2013–2017) targeted coal combustion, vehicle emissions, industrial pollution, and cross-city enforcement. Results: 290 days of good air quality in Beijing (114 more than 2013), heavily polluted days dropped 96.6% (58 → 2 by 2024), hailed as the “Beijing Miracle.”
China also launched rural renewable initiatives: Thousand Villages Harnessing Wind Action and the Photovoltaic Poverty Alleviation Project (PPAP, 2014), building PV power stations in 60,000 villages, creating 1.25 million jobs and generating 18 billion yuan annually. Example: Ruoqiang PV Project, 4 GW capacity.
China aims to peak carbon emissions by 2030 and reach net carbon neutrality by 2060. Current emissions are 1% less than peak levels, due to renewable energy transition rather than economic downturn.
Case Study: Bangladesh (LEDC)
Natural Causes of Flooding
- Three major rivers—Brahmaputra, Ganges, Padma—flow downstream from India & China, with annual discharge 100–140,000 cumecs.
- Bangladesh is naturally prone to flooding; up to 25% of the country floods annually, rarely up to 60% once per century.
- Indian monsoon → heavy summer rainfall.
Positive Impacts of Flooding
- Agriculture: Sediment deposition enriches riverbanks, producing fertile soil.
- Environmental: Sustains floodplain ecosystems.
Negative Impacts of Flooding
- Economic:
 Increasing areas affected correlate with rising economic damage (UCL study).
 - Social: Unequal impact on communities; women and female-led households in Haor region most affected due to occupational restrictions.
Failures in Flood Management
- Embankments prevent coastal flooding but disrupt natural sediment deposition, harm floodplain ecosystems, and cause waterlogging.
- Waterlogging contributes to mosquito-borne diseases.
Successes in Flood Management
- Collaboration with international agencies and implementation of climate-smart infrastructure.
- Community resilience initiatives in high-risk areas.
Global Interactions – UNFCCC
The United Nations Framework Convention on Climate Change (UNFCCC, 1992) was signed by 198 states at the Rio Earth Summit. It discusses international cooperation, sustainable development, and climate mitigation strategies.
Sustainable Solutions: Case Studies
- Chicago City Hall Green Roof: Green roofs improve energy efficiency, reduce urban heat island effect, and provide stakeholder benefits (Source: greenroofs.com).
- China’s Renewable Energy Policies: Transition from coal to solar, wind, and hydropower to reduce emissions and boost rural development.
Disparities: LEDCs vs MEDCs
LEDCs often face more devastating climate impacts but have less voice in international climate discussions. MEDCs can invest in mitigation, technology, and disaster preparedness, while LEDCs focus on adaptation and recovery.